Hispanic or Latino vs Scotch-Irish In Labor Force | Age 20-64
COMPARE
Hispanic or Latino
Scotch-Irish
In Labor Force | Age 20-64
In Labor Force | Age 20-64 Comparison
Hispanics or Latinos
Scotch-Irish
77.6%
IN LABOR FORCE | AGE 20-64
0.0/ 100
METRIC RATING
299th/ 347
METRIC RANK
78.3%
IN LABOR FORCE | AGE 20-64
0.0/ 100
METRIC RATING
270th/ 347
METRIC RANK
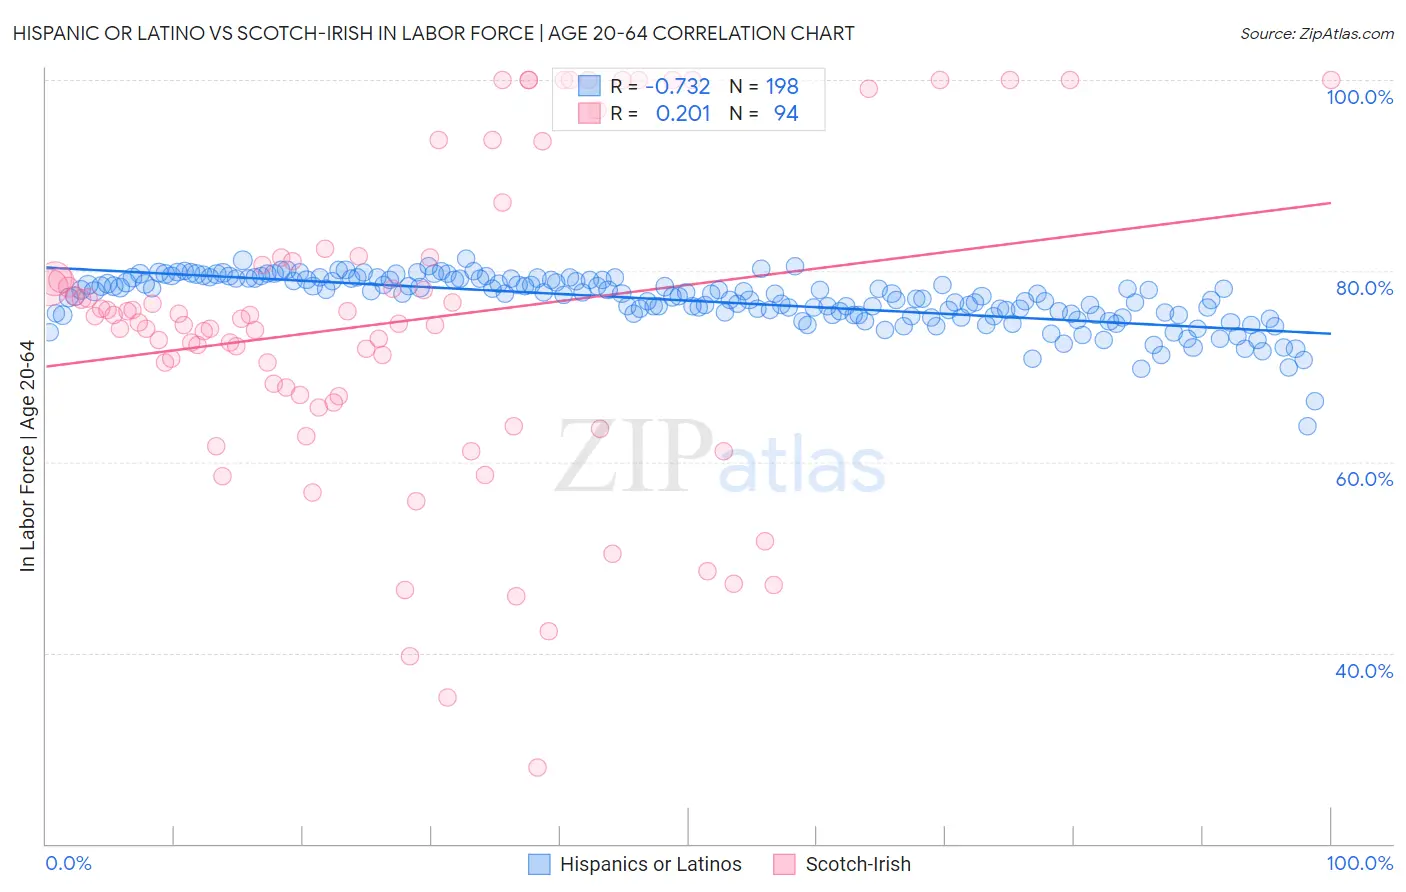
Hispanic or Latino vs Scotch-Irish In Labor Force | Age 20-64 Correlation Chart
The statistical analysis conducted on geographies consisting of 575,448,606 people shows a strong negative correlation between the proportion of Hispanics or Latinos and labor force participation rate among population between the ages 20 and 64 in the United States with a correlation coefficient (R) of -0.732 and weighted average of 77.6%. Similarly, the statistical analysis conducted on geographies consisting of 548,766,362 people shows a weak positive correlation between the proportion of Scotch-Irish and labor force participation rate among population between the ages 20 and 64 in the United States with a correlation coefficient (R) of 0.201 and weighted average of 78.3%, a difference of 0.87%.
In Labor Force | Age 20-64 Correlation Summary
| Measurement | Hispanic or Latino | Scotch-Irish |
| Minimum | 63.7% | 28.0% |
| Maximum | 81.2% | 100.0% |
| Range | 17.6% | 72.0% |
| Mean | 76.9% | 74.6% |
| Median | 77.6% | 74.8% |
| Interquartile 25% (IQ1) | 75.4% | 66.9% |
| Interquartile 75% (IQ3) | 79.1% | 81.3% |
| Interquartile Range (IQR) | 3.7% | 14.5% |
| Standard Deviation (Sample) | 2.7% | 16.5% |
| Standard Deviation (Population) | 2.7% | 16.4% |
Similar Demographics by In Labor Force | Age 20-64
Demographics Similar to Hispanics or Latinos by In Labor Force | Age 20-64
In terms of in labor force | age 20-64, the demographic groups most similar to Hispanics or Latinos are Cree (77.7%, a difference of 0.060%), Immigrants from Dominican Republic (77.7%, a difference of 0.070%), Dominican (77.7%, a difference of 0.070%), Spanish American Indian (77.6%, a difference of 0.070%), and Immigrants from Grenada (77.7%, a difference of 0.11%).
| Demographics | Rating | Rank | In Labor Force | Age 20-64 |
| Immigrants | Azores | 0.0 /100 | #292 | Tragic 77.8% |
| Delaware | 0.0 /100 | #293 | Tragic 77.8% |
| Immigrants | Central America | 0.0 /100 | #294 | Tragic 77.7% |
| Immigrants | Grenada | 0.0 /100 | #295 | Tragic 77.7% |
| Immigrants | Dominican Republic | 0.0 /100 | #296 | Tragic 77.7% |
| Dominicans | 0.0 /100 | #297 | Tragic 77.7% |
| Cree | 0.0 /100 | #298 | Tragic 77.7% |
| Hispanics or Latinos | 0.0 /100 | #299 | Tragic 77.6% |
| Spanish American Indians | 0.0 /100 | #300 | Tragic 77.6% |
| Nepalese | 0.0 /100 | #301 | Tragic 77.5% |
| Iroquois | 0.0 /100 | #302 | Tragic 77.5% |
| Chippewa | 0.0 /100 | #303 | Tragic 77.3% |
| Immigrants | Mexico | 0.0 /100 | #304 | Tragic 77.3% |
| Mexicans | 0.0 /100 | #305 | Tragic 77.2% |
| Potawatomi | 0.0 /100 | #306 | Tragic 77.2% |
Demographics Similar to Scotch-Irish by In Labor Force | Age 20-64
In terms of in labor force | age 20-64, the demographic groups most similar to Scotch-Irish are Immigrants from Barbados (78.3%, a difference of 0.020%), Immigrants from Latin America (78.3%, a difference of 0.020%), Marshallese (78.3%, a difference of 0.020%), French American Indian (78.2%, a difference of 0.070%), and West Indian (78.3%, a difference of 0.080%).
| Demographics | Rating | Rank | In Labor Force | Age 20-64 |
| Pennsylvania Germans | 0.1 /100 | #263 | Tragic 78.4% |
| Spaniards | 0.1 /100 | #264 | Tragic 78.4% |
| British West Indians | 0.1 /100 | #265 | Tragic 78.4% |
| Bahamians | 0.1 /100 | #266 | Tragic 78.4% |
| U.S. Virgin Islanders | 0.1 /100 | #267 | Tragic 78.4% |
| West Indians | 0.0 /100 | #268 | Tragic 78.3% |
| Immigrants | Barbados | 0.0 /100 | #269 | Tragic 78.3% |
| Scotch-Irish | 0.0 /100 | #270 | Tragic 78.3% |
| Immigrants | Latin America | 0.0 /100 | #271 | Tragic 78.3% |
| Marshallese | 0.0 /100 | #272 | Tragic 78.3% |
| French American Indians | 0.0 /100 | #273 | Tragic 78.2% |
| Aleuts | 0.0 /100 | #274 | Tragic 78.2% |
| Spanish | 0.0 /100 | #275 | Tragic 78.2% |
| Puget Sound Salish | 0.0 /100 | #276 | Tragic 78.2% |
| Immigrants | Bahamas | 0.0 /100 | #277 | Tragic 78.2% |