Immigrants from Bulgaria vs Comanche In Labor Force | Age 35-44
COMPARE
Immigrants from Bulgaria
Comanche
In Labor Force | Age 35-44
In Labor Force | Age 35-44 Comparison
Immigrants from Bulgaria
Comanche
85.2%
IN LABOR FORCE | AGE 35-44
99.8/ 100
METRIC RATING
40th/ 347
METRIC RANK
81.5%
IN LABOR FORCE | AGE 35-44
0.0/ 100
METRIC RATING
316th/ 347
METRIC RANK
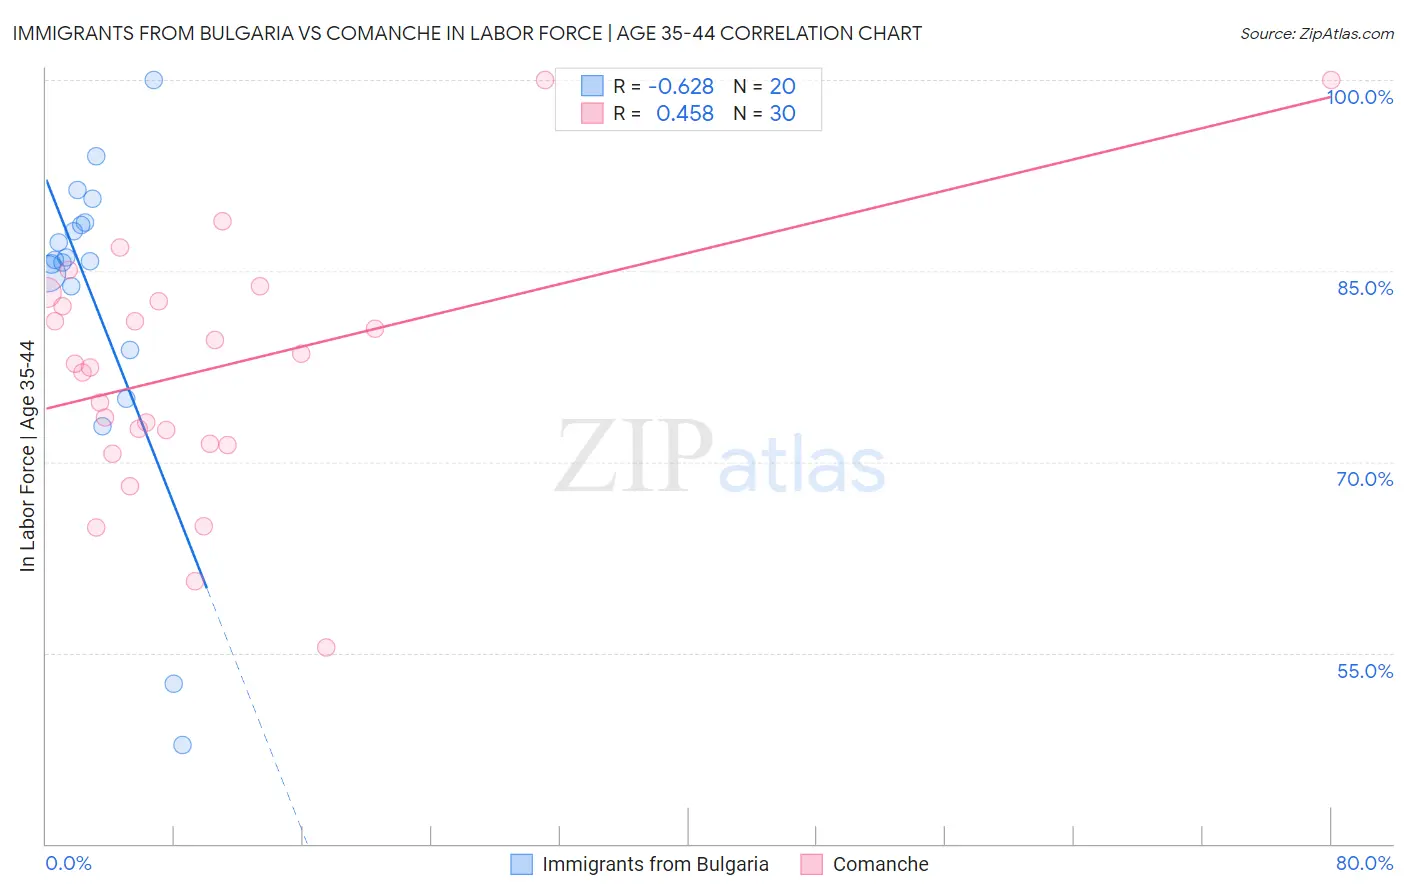
Immigrants from Bulgaria vs Comanche In Labor Force | Age 35-44 Correlation Chart
The statistical analysis conducted on geographies consisting of 172,540,791 people shows a significant negative correlation between the proportion of Immigrants from Bulgaria and labor force participation rate among population between the ages 35 and 44 in the United States with a correlation coefficient (R) of -0.628 and weighted average of 85.2%. Similarly, the statistical analysis conducted on geographies consisting of 109,773,192 people shows a moderate positive correlation between the proportion of Comanche and labor force participation rate among population between the ages 35 and 44 in the United States with a correlation coefficient (R) of 0.458 and weighted average of 81.5%, a difference of 4.6%.
In Labor Force | Age 35-44 Correlation Summary
| Measurement | Immigrants from Bulgaria | Comanche |
| Minimum | 47.8% | 55.4% |
| Maximum | 100.0% | 100.0% |
| Range | 52.2% | 44.6% |
| Mean | 82.7% | 77.3% |
| Median | 85.8% | 77.6% |
| Interquartile 25% (IQ1) | 81.3% | 71.4% |
| Interquartile 75% (IQ3) | 88.7% | 82.6% |
| Interquartile Range (IQR) | 7.4% | 11.2% |
| Standard Deviation (Sample) | 12.6% | 9.9% |
| Standard Deviation (Population) | 12.3% | 9.7% |
Similar Demographics by In Labor Force | Age 35-44
Demographics Similar to Immigrants from Bulgaria by In Labor Force | Age 35-44
In terms of in labor force | age 35-44, the demographic groups most similar to Immigrants from Bulgaria are Immigrants from Zimbabwe (85.2%, a difference of 0.0%), Macedonian (85.2%, a difference of 0.0%), Immigrants from Poland (85.2%, a difference of 0.010%), Eastern European (85.2%, a difference of 0.010%), and Polish (85.2%, a difference of 0.010%).
| Demographics | Rating | Rank | In Labor Force | Age 35-44 |
| Ugandans | 99.9 /100 | #33 | Exceptional 85.3% |
| Immigrants | Nepal | 99.9 /100 | #34 | Exceptional 85.3% |
| Estonians | 99.9 /100 | #35 | Exceptional 85.3% |
| Immigrants | Morocco | 99.8 /100 | #36 | Exceptional 85.2% |
| Kenyans | 99.8 /100 | #37 | Exceptional 85.2% |
| Immigrants | Poland | 99.8 /100 | #38 | Exceptional 85.2% |
| Eastern Europeans | 99.8 /100 | #39 | Exceptional 85.2% |
| Immigrants | Bulgaria | 99.8 /100 | #40 | Exceptional 85.2% |
| Immigrants | Zimbabwe | 99.8 /100 | #41 | Exceptional 85.2% |
| Macedonians | 99.8 /100 | #42 | Exceptional 85.2% |
| Poles | 99.8 /100 | #43 | Exceptional 85.2% |
| Lithuanians | 99.8 /100 | #44 | Exceptional 85.2% |
| Cypriots | 99.8 /100 | #45 | Exceptional 85.2% |
| Immigrants | Hong Kong | 99.8 /100 | #46 | Exceptional 85.2% |
| German Russians | 99.8 /100 | #47 | Exceptional 85.2% |
Demographics Similar to Comanche by In Labor Force | Age 35-44
In terms of in labor force | age 35-44, the demographic groups most similar to Comanche are Immigrants from Mexico (81.5%, a difference of 0.020%), Cajun (81.5%, a difference of 0.050%), Cherokee (81.4%, a difference of 0.080%), Alaska Native (81.6%, a difference of 0.16%), and Mexican (81.6%, a difference of 0.16%).
| Demographics | Rating | Rank | In Labor Force | Age 35-44 |
| Cree | 0.0 /100 | #309 | Tragic 82.0% |
| Blackfeet | 0.0 /100 | #310 | Tragic 81.9% |
| Colville | 0.0 /100 | #311 | Tragic 81.7% |
| Alaska Natives | 0.0 /100 | #312 | Tragic 81.6% |
| Mexicans | 0.0 /100 | #313 | Tragic 81.6% |
| Cajuns | 0.0 /100 | #314 | Tragic 81.5% |
| Immigrants | Mexico | 0.0 /100 | #315 | Tragic 81.5% |
| Comanche | 0.0 /100 | #316 | Tragic 81.5% |
| Cherokee | 0.0 /100 | #317 | Tragic 81.4% |
| Alaskan Athabascans | 0.0 /100 | #318 | Tragic 81.3% |
| Inupiat | 0.0 /100 | #319 | Tragic 80.9% |
| Chickasaw | 0.0 /100 | #320 | Tragic 80.9% |
| Puerto Ricans | 0.0 /100 | #321 | Tragic 80.7% |
| Paiute | 0.0 /100 | #322 | Tragic 80.6% |
| Yaqui | 0.0 /100 | #323 | Tragic 80.5% |