European vs Comanche In Labor Force | Age 35-44
COMPARE
European
Comanche
In Labor Force | Age 35-44
In Labor Force | Age 35-44 Comparison
Europeans
Comanche
84.1%
IN LABOR FORCE | AGE 35-44
12.2/ 100
METRIC RATING
215th/ 347
METRIC RANK
81.5%
IN LABOR FORCE | AGE 35-44
0.0/ 100
METRIC RATING
316th/ 347
METRIC RANK
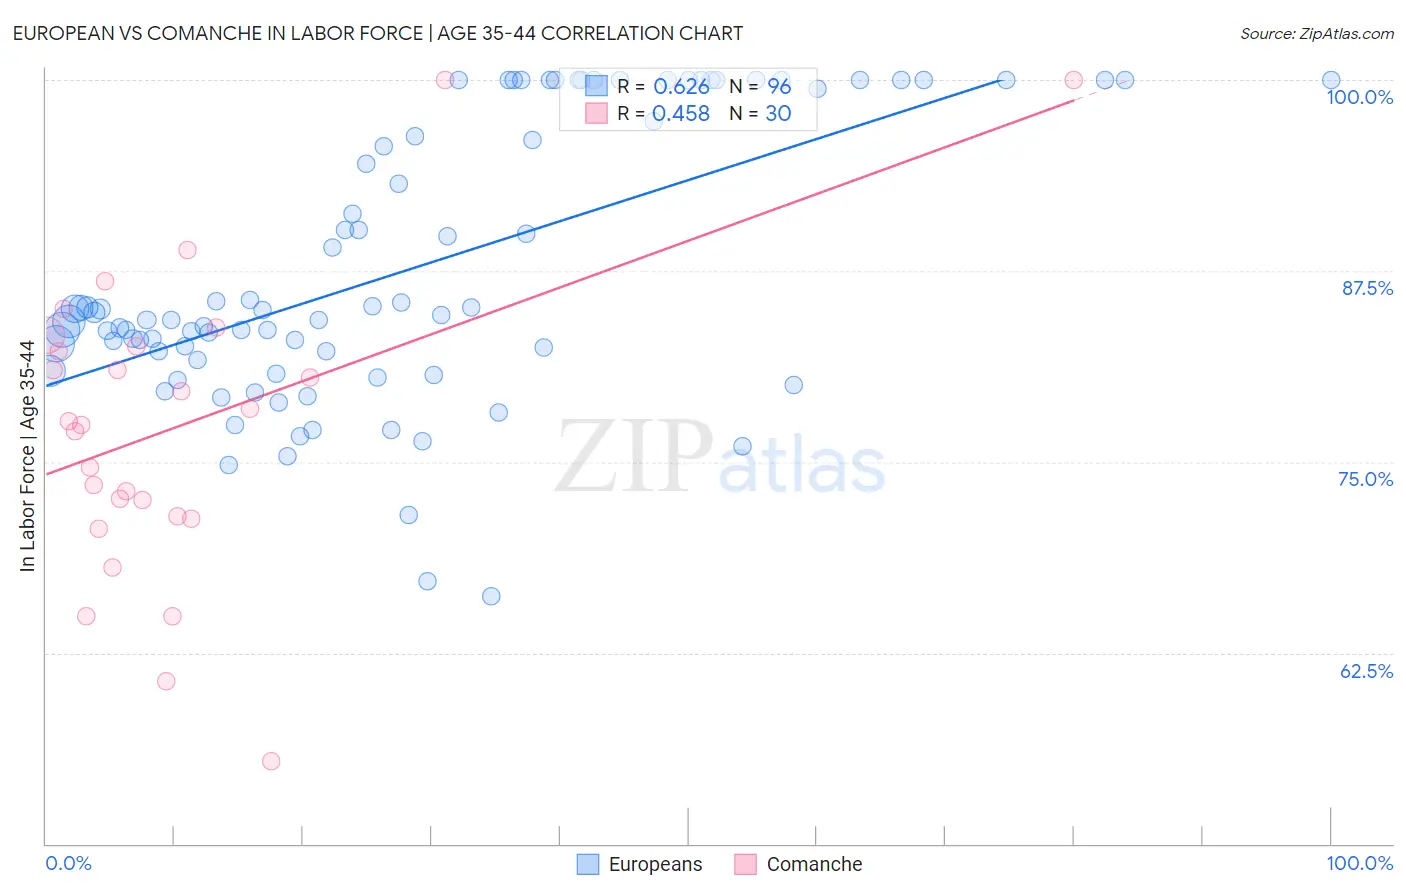
European vs Comanche In Labor Force | Age 35-44 Correlation Chart
The statistical analysis conducted on geographies consisting of 561,223,760 people shows a significant positive correlation between the proportion of Europeans and labor force participation rate among population between the ages 35 and 44 in the United States with a correlation coefficient (R) of 0.626 and weighted average of 84.1%. Similarly, the statistical analysis conducted on geographies consisting of 109,773,192 people shows a moderate positive correlation between the proportion of Comanche and labor force participation rate among population between the ages 35 and 44 in the United States with a correlation coefficient (R) of 0.458 and weighted average of 81.5%, a difference of 3.2%.
In Labor Force | Age 35-44 Correlation Summary
| Measurement | European | Comanche |
| Minimum | 66.2% | 55.4% |
| Maximum | 100.0% | 100.0% |
| Range | 33.8% | 44.6% |
| Mean | 87.6% | 77.3% |
| Median | 84.7% | 77.6% |
| Interquartile 25% (IQ1) | 81.9% | 71.4% |
| Interquartile 75% (IQ3) | 99.7% | 82.6% |
| Interquartile Range (IQR) | 17.8% | 11.2% |
| Standard Deviation (Sample) | 9.0% | 9.9% |
| Standard Deviation (Population) | 8.9% | 9.7% |
Similar Demographics by In Labor Force | Age 35-44
Demographics Similar to Europeans by In Labor Force | Age 35-44
In terms of in labor force | age 35-44, the demographic groups most similar to Europeans are Nicaraguan (84.1%, a difference of 0.0%), Immigrants from Barbados (84.1%, a difference of 0.010%), Immigrants from Norway (84.1%, a difference of 0.010%), Bangladeshi (84.1%, a difference of 0.020%), and Israeli (84.1%, a difference of 0.030%).
| Demographics | Rating | Rank | In Labor Force | Age 35-44 |
| Immigrants | North America | 18.1 /100 | #208 | Poor 84.2% |
| Swiss | 17.4 /100 | #209 | Poor 84.2% |
| New Zealanders | 16.2 /100 | #210 | Poor 84.1% |
| Immigrants | Ecuador | 15.2 /100 | #211 | Poor 84.1% |
| Israelis | 14.0 /100 | #212 | Poor 84.1% |
| Bangladeshis | 13.7 /100 | #213 | Poor 84.1% |
| Immigrants | Barbados | 13.2 /100 | #214 | Poor 84.1% |
| Europeans | 12.2 /100 | #215 | Poor 84.1% |
| Nicaraguans | 12.1 /100 | #216 | Poor 84.1% |
| Immigrants | Norway | 11.7 /100 | #217 | Poor 84.1% |
| Immigrants | Nicaragua | 9.4 /100 | #218 | Tragic 84.1% |
| Sub-Saharan Africans | 9.3 /100 | #219 | Tragic 84.1% |
| French | 7.5 /100 | #220 | Tragic 84.0% |
| Icelanders | 6.7 /100 | #221 | Tragic 84.0% |
| Assyrians/Chaldeans/Syriacs | 6.6 /100 | #222 | Tragic 84.0% |
Demographics Similar to Comanche by In Labor Force | Age 35-44
In terms of in labor force | age 35-44, the demographic groups most similar to Comanche are Immigrants from Mexico (81.5%, a difference of 0.020%), Cajun (81.5%, a difference of 0.050%), Cherokee (81.4%, a difference of 0.080%), Alaska Native (81.6%, a difference of 0.16%), and Mexican (81.6%, a difference of 0.16%).
| Demographics | Rating | Rank | In Labor Force | Age 35-44 |
| Cree | 0.0 /100 | #309 | Tragic 82.0% |
| Blackfeet | 0.0 /100 | #310 | Tragic 81.9% |
| Colville | 0.0 /100 | #311 | Tragic 81.7% |
| Alaska Natives | 0.0 /100 | #312 | Tragic 81.6% |
| Mexicans | 0.0 /100 | #313 | Tragic 81.6% |
| Cajuns | 0.0 /100 | #314 | Tragic 81.5% |
| Immigrants | Mexico | 0.0 /100 | #315 | Tragic 81.5% |
| Comanche | 0.0 /100 | #316 | Tragic 81.5% |
| Cherokee | 0.0 /100 | #317 | Tragic 81.4% |
| Alaskan Athabascans | 0.0 /100 | #318 | Tragic 81.3% |
| Inupiat | 0.0 /100 | #319 | Tragic 80.9% |
| Chickasaw | 0.0 /100 | #320 | Tragic 80.9% |
| Puerto Ricans | 0.0 /100 | #321 | Tragic 80.7% |
| Paiute | 0.0 /100 | #322 | Tragic 80.6% |
| Yaqui | 0.0 /100 | #323 | Tragic 80.5% |