Immigrants from Sudan vs Comanche In Labor Force | Age 35-44
COMPARE
Immigrants from Sudan
Comanche
In Labor Force | Age 35-44
In Labor Force | Age 35-44 Comparison
Immigrants from Sudan
Comanche
84.9%
IN LABOR FORCE | AGE 35-44
98.1/ 100
METRIC RATING
82nd/ 347
METRIC RANK
81.5%
IN LABOR FORCE | AGE 35-44
0.0/ 100
METRIC RATING
316th/ 347
METRIC RANK
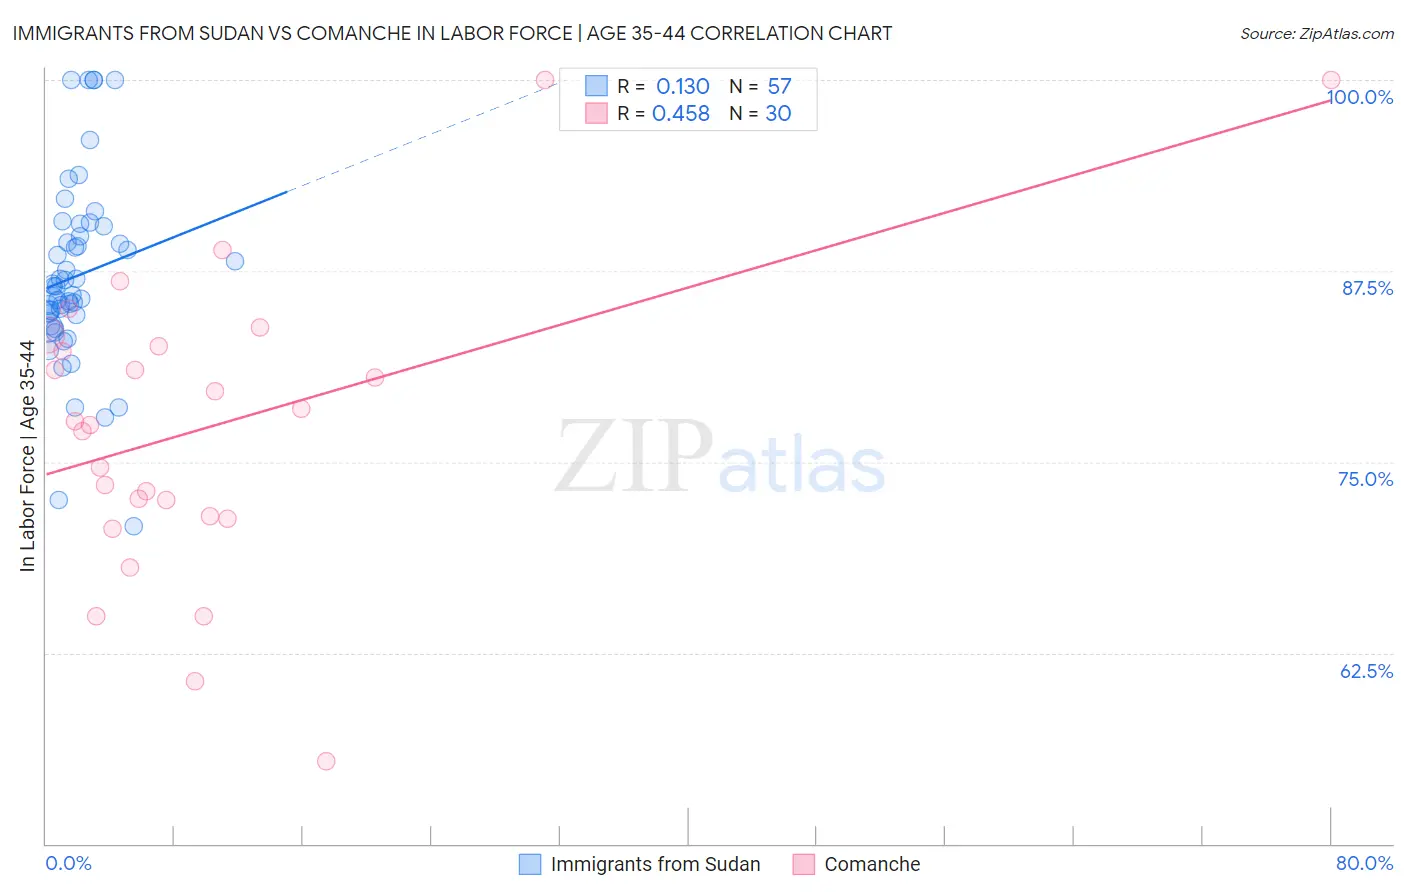
Immigrants from Sudan vs Comanche In Labor Force | Age 35-44 Correlation Chart
The statistical analysis conducted on geographies consisting of 118,957,461 people shows a poor positive correlation between the proportion of Immigrants from Sudan and labor force participation rate among population between the ages 35 and 44 in the United States with a correlation coefficient (R) of 0.130 and weighted average of 84.9%. Similarly, the statistical analysis conducted on geographies consisting of 109,773,192 people shows a moderate positive correlation between the proportion of Comanche and labor force participation rate among population between the ages 35 and 44 in the United States with a correlation coefficient (R) of 0.458 and weighted average of 81.5%, a difference of 4.2%.
In Labor Force | Age 35-44 Correlation Summary
| Measurement | Immigrants from Sudan | Comanche |
| Minimum | 70.8% | 55.4% |
| Maximum | 100.0% | 100.0% |
| Range | 29.2% | 44.6% |
| Mean | 87.2% | 77.3% |
| Median | 86.5% | 77.6% |
| Interquartile 25% (IQ1) | 84.2% | 71.4% |
| Interquartile 75% (IQ3) | 90.1% | 82.6% |
| Interquartile Range (IQR) | 5.8% | 11.2% |
| Standard Deviation (Sample) | 6.1% | 9.9% |
| Standard Deviation (Population) | 6.0% | 9.7% |
Similar Demographics by In Labor Force | Age 35-44
Demographics Similar to Immigrants from Sudan by In Labor Force | Age 35-44
In terms of in labor force | age 35-44, the demographic groups most similar to Immigrants from Sudan are Peruvian (84.9%, a difference of 0.020%), Immigrants from Colombia (84.9%, a difference of 0.020%), Immigrants from Eastern Europe (84.9%, a difference of 0.020%), Senegalese (84.9%, a difference of 0.020%), and Immigrants from Peru (84.9%, a difference of 0.020%).
| Demographics | Rating | Rank | In Labor Force | Age 35-44 |
| Immigrants | South Central Asia | 98.7 /100 | #75 | Exceptional 85.0% |
| Immigrants | Cuba | 98.6 /100 | #76 | Exceptional 84.9% |
| Immigrants | Turkey | 98.6 /100 | #77 | Exceptional 84.9% |
| Immigrants | Africa | 98.4 /100 | #78 | Exceptional 84.9% |
| Peruvians | 98.3 /100 | #79 | Exceptional 84.9% |
| Immigrants | Colombia | 98.3 /100 | #80 | Exceptional 84.9% |
| Immigrants | Eastern Europe | 98.3 /100 | #81 | Exceptional 84.9% |
| Immigrants | Sudan | 98.1 /100 | #82 | Exceptional 84.9% |
| Senegalese | 97.8 /100 | #83 | Exceptional 84.9% |
| Immigrants | Peru | 97.8 /100 | #84 | Exceptional 84.9% |
| Immigrants | Middle Africa | 97.8 /100 | #85 | Exceptional 84.9% |
| Greeks | 97.8 /100 | #86 | Exceptional 84.9% |
| Belgians | 97.7 /100 | #87 | Exceptional 84.9% |
| Yugoslavians | 97.7 /100 | #88 | Exceptional 84.9% |
| Immigrants | Pakistan | 97.5 /100 | #89 | Exceptional 84.9% |
Demographics Similar to Comanche by In Labor Force | Age 35-44
In terms of in labor force | age 35-44, the demographic groups most similar to Comanche are Immigrants from Mexico (81.5%, a difference of 0.020%), Cajun (81.5%, a difference of 0.050%), Cherokee (81.4%, a difference of 0.080%), Alaska Native (81.6%, a difference of 0.16%), and Mexican (81.6%, a difference of 0.16%).
| Demographics | Rating | Rank | In Labor Force | Age 35-44 |
| Cree | 0.0 /100 | #309 | Tragic 82.0% |
| Blackfeet | 0.0 /100 | #310 | Tragic 81.9% |
| Colville | 0.0 /100 | #311 | Tragic 81.7% |
| Alaska Natives | 0.0 /100 | #312 | Tragic 81.6% |
| Mexicans | 0.0 /100 | #313 | Tragic 81.6% |
| Cajuns | 0.0 /100 | #314 | Tragic 81.5% |
| Immigrants | Mexico | 0.0 /100 | #315 | Tragic 81.5% |
| Comanche | 0.0 /100 | #316 | Tragic 81.5% |
| Cherokee | 0.0 /100 | #317 | Tragic 81.4% |
| Alaskan Athabascans | 0.0 /100 | #318 | Tragic 81.3% |
| Inupiat | 0.0 /100 | #319 | Tragic 80.9% |
| Chickasaw | 0.0 /100 | #320 | Tragic 80.9% |
| Puerto Ricans | 0.0 /100 | #321 | Tragic 80.7% |
| Paiute | 0.0 /100 | #322 | Tragic 80.6% |
| Yaqui | 0.0 /100 | #323 | Tragic 80.5% |