Ethiopian vs Immigrants from Lebanon In Labor Force | Age 35-44
COMPARE
Ethiopian
Immigrants from Lebanon
In Labor Force | Age 35-44
In Labor Force | Age 35-44 Comparison
Ethiopians
Immigrants from Lebanon
85.9%
IN LABOR FORCE | AGE 35-44
100.0/ 100
METRIC RATING
9th/ 347
METRIC RANK
82.7%
IN LABOR FORCE | AGE 35-44
0.0/ 100
METRIC RATING
295th/ 347
METRIC RANK
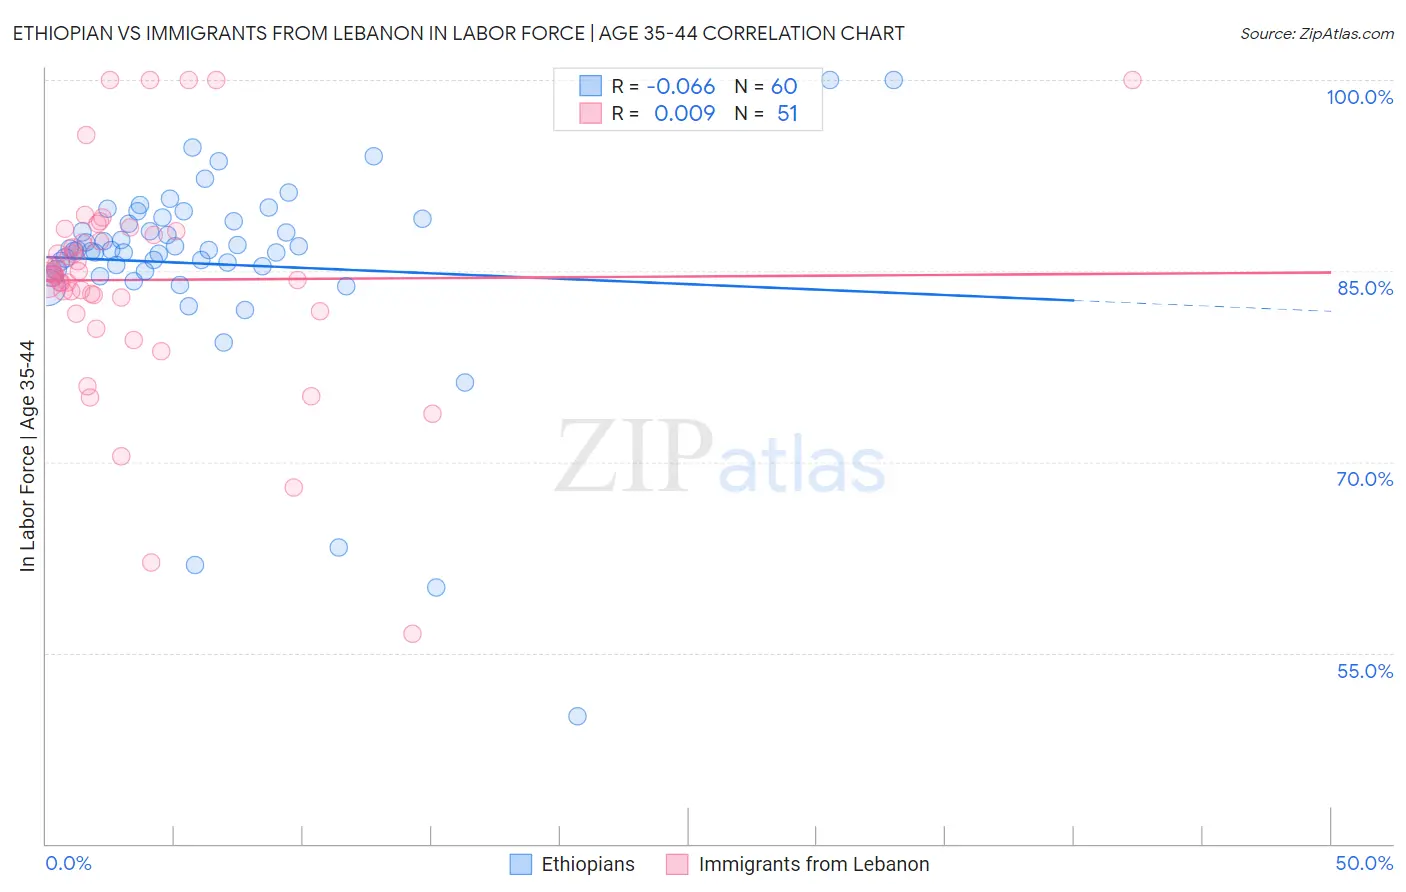
Ethiopian vs Immigrants from Lebanon In Labor Force | Age 35-44 Correlation Chart
The statistical analysis conducted on geographies consisting of 223,141,148 people shows a slight negative correlation between the proportion of Ethiopians and labor force participation rate among population between the ages 35 and 44 in the United States with a correlation coefficient (R) of -0.066 and weighted average of 85.9%. Similarly, the statistical analysis conducted on geographies consisting of 217,122,432 people shows no correlation between the proportion of Immigrants from Lebanon and labor force participation rate among population between the ages 35 and 44 in the United States with a correlation coefficient (R) of 0.009 and weighted average of 82.7%, a difference of 3.9%.
In Labor Force | Age 35-44 Correlation Summary
| Measurement | Ethiopian | Immigrants from Lebanon |
| Minimum | 50.0% | 56.5% |
| Maximum | 100.0% | 100.0% |
| Range | 50.0% | 43.5% |
| Mean | 85.5% | 84.3% |
| Median | 86.7% | 84.7% |
| Interquartile 25% (IQ1) | 85.0% | 81.8% |
| Interquartile 75% (IQ3) | 89.0% | 88.1% |
| Interquartile Range (IQR) | 3.9% | 6.3% |
| Standard Deviation (Sample) | 8.3% | 8.6% |
| Standard Deviation (Population) | 8.2% | 8.5% |
Similar Demographics by In Labor Force | Age 35-44
Demographics Similar to Ethiopians by In Labor Force | Age 35-44
In terms of in labor force | age 35-44, the demographic groups most similar to Ethiopians are Immigrants from Ethiopia (85.9%, a difference of 0.0%), Cape Verdean (85.8%, a difference of 0.13%), Immigrants from Cameroon (85.8%, a difference of 0.16%), Immigrants from Sierra Leone (86.1%, a difference of 0.18%), and Bolivian (86.1%, a difference of 0.21%).
| Demographics | Rating | Rank | In Labor Force | Age 35-44 |
| Luxembourgers | 100.0 /100 | #2 | Exceptional 86.4% |
| Immigrants | Bolivia | 100.0 /100 | #3 | Exceptional 86.2% |
| Immigrants | Cabo Verde | 100.0 /100 | #4 | Exceptional 86.2% |
| Zimbabweans | 100.0 /100 | #5 | Exceptional 86.1% |
| Bolivians | 100.0 /100 | #6 | Exceptional 86.1% |
| Immigrants | Sierra Leone | 100.0 /100 | #7 | Exceptional 86.1% |
| Immigrants | Ethiopia | 100.0 /100 | #8 | Exceptional 85.9% |
| Ethiopians | 100.0 /100 | #9 | Exceptional 85.9% |
| Cape Verdeans | 100.0 /100 | #10 | Exceptional 85.8% |
| Immigrants | Cameroon | 100.0 /100 | #11 | Exceptional 85.8% |
| Liberians | 100.0 /100 | #12 | Exceptional 85.7% |
| Somalis | 100.0 /100 | #13 | Exceptional 85.6% |
| Immigrants | Somalia | 100.0 /100 | #14 | Exceptional 85.6% |
| Norwegians | 100.0 /100 | #15 | Exceptional 85.6% |
| Immigrants | Ireland | 100.0 /100 | #16 | Exceptional 85.6% |
Demographics Similar to Immigrants from Lebanon by In Labor Force | Age 35-44
In terms of in labor force | age 35-44, the demographic groups most similar to Immigrants from Lebanon are Potawatomi (82.7%, a difference of 0.050%), Mexican American Indian (82.6%, a difference of 0.10%), Hmong (82.6%, a difference of 0.10%), Ottawa (82.6%, a difference of 0.12%), and Spanish American (82.8%, a difference of 0.13%).
| Demographics | Rating | Rank | In Labor Force | Age 35-44 |
| Puget Sound Salish | 0.0 /100 | #288 | Tragic 82.9% |
| Chippewa | 0.0 /100 | #289 | Tragic 82.9% |
| Africans | 0.0 /100 | #290 | Tragic 82.9% |
| Pennsylvania Germans | 0.0 /100 | #291 | Tragic 82.9% |
| Immigrants | Latin America | 0.0 /100 | #292 | Tragic 82.8% |
| Spanish Americans | 0.0 /100 | #293 | Tragic 82.8% |
| Potawatomi | 0.0 /100 | #294 | Tragic 82.7% |
| Immigrants | Lebanon | 0.0 /100 | #295 | Tragic 82.7% |
| Mexican American Indians | 0.0 /100 | #296 | Tragic 82.6% |
| Hmong | 0.0 /100 | #297 | Tragic 82.6% |
| Ottawa | 0.0 /100 | #298 | Tragic 82.6% |
| Tlingit-Haida | 0.0 /100 | #299 | Tragic 82.5% |
| Central American Indians | 0.0 /100 | #300 | Tragic 82.5% |
| Spanish American Indians | 0.0 /100 | #301 | Tragic 82.5% |
| Americans | 0.0 /100 | #302 | Tragic 82.4% |