Mexican American Indian vs Comanche In Labor Force | Age 35-44
COMPARE
Mexican American Indian
Comanche
In Labor Force | Age 35-44
In Labor Force | Age 35-44 Comparison
Mexican American Indians
Comanche
82.6%
IN LABOR FORCE | AGE 35-44
0.0/ 100
METRIC RATING
296th/ 347
METRIC RANK
81.5%
IN LABOR FORCE | AGE 35-44
0.0/ 100
METRIC RATING
316th/ 347
METRIC RANK
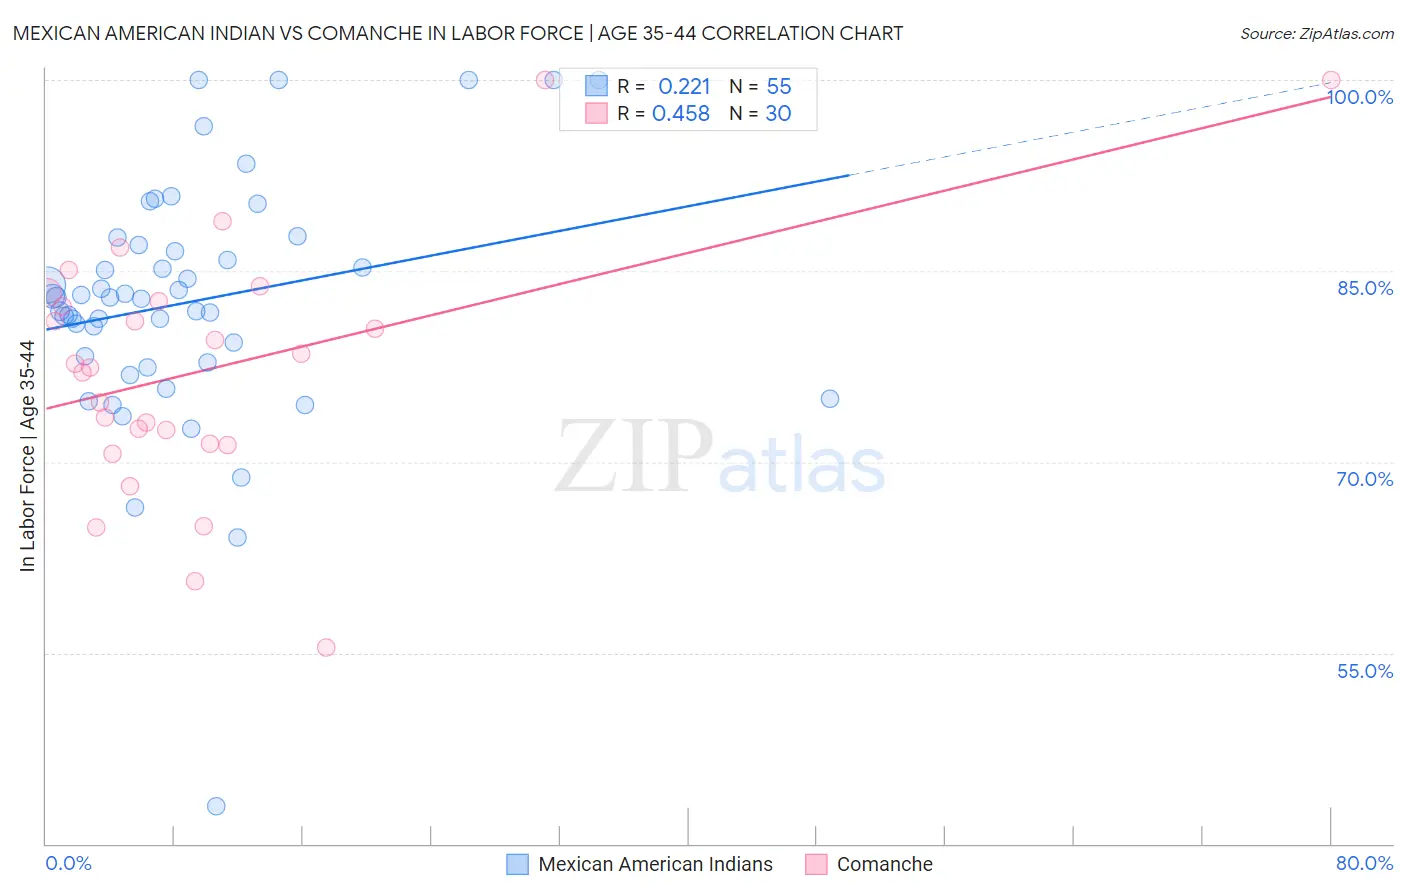
Mexican American Indian vs Comanche In Labor Force | Age 35-44 Correlation Chart
The statistical analysis conducted on geographies consisting of 317,545,912 people shows a weak positive correlation between the proportion of Mexican American Indians and labor force participation rate among population between the ages 35 and 44 in the United States with a correlation coefficient (R) of 0.221 and weighted average of 82.6%. Similarly, the statistical analysis conducted on geographies consisting of 109,773,192 people shows a moderate positive correlation between the proportion of Comanche and labor force participation rate among population between the ages 35 and 44 in the United States with a correlation coefficient (R) of 0.458 and weighted average of 81.5%, a difference of 1.4%.
In Labor Force | Age 35-44 Correlation Summary
| Measurement | Mexican American Indian | Comanche |
| Minimum | 42.9% | 55.4% |
| Maximum | 100.0% | 100.0% |
| Range | 57.1% | 44.6% |
| Mean | 82.6% | 77.3% |
| Median | 82.9% | 77.6% |
| Interquartile 25% (IQ1) | 77.8% | 71.4% |
| Interquartile 75% (IQ3) | 87.0% | 82.6% |
| Interquartile Range (IQR) | 9.2% | 11.2% |
| Standard Deviation (Sample) | 9.8% | 9.9% |
| Standard Deviation (Population) | 9.7% | 9.7% |
Demographics Similar to Mexican American Indians and Comanche by In Labor Force | Age 35-44
In terms of in labor force | age 35-44, the demographic groups most similar to Mexican American Indians are Hmong (82.6%, a difference of 0.010%), Ottawa (82.6%, a difference of 0.020%), Tlingit-Haida (82.5%, a difference of 0.040%), Central American Indian (82.5%, a difference of 0.10%), and Spanish American Indian (82.5%, a difference of 0.12%). Similarly, the demographic groups most similar to Comanche are Immigrants from Mexico (81.5%, a difference of 0.020%), Cajun (81.5%, a difference of 0.050%), Alaska Native (81.6%, a difference of 0.16%), Mexican (81.6%, a difference of 0.16%), and Colville (81.7%, a difference of 0.31%).
| Demographics | Rating | Rank | In Labor Force | Age 35-44 |
| Mexican American Indians | 0.0 /100 | #296 | Tragic 82.6% |
| Hmong | 0.0 /100 | #297 | Tragic 82.6% |
| Ottawa | 0.0 /100 | #298 | Tragic 82.6% |
| Tlingit-Haida | 0.0 /100 | #299 | Tragic 82.5% |
| Central American Indians | 0.0 /100 | #300 | Tragic 82.5% |
| Spanish American Indians | 0.0 /100 | #301 | Tragic 82.5% |
| Americans | 0.0 /100 | #302 | Tragic 82.4% |
| Nepalese | 0.0 /100 | #303 | Tragic 82.4% |
| Marshallese | 0.0 /100 | #304 | Tragic 82.4% |
| Shoshone | 0.0 /100 | #305 | Tragic 82.2% |
| Blacks/African Americans | 0.0 /100 | #306 | Tragic 82.2% |
| Hispanics or Latinos | 0.0 /100 | #307 | Tragic 82.1% |
| Immigrants | Central America | 0.0 /100 | #308 | Tragic 82.0% |
| Cree | 0.0 /100 | #309 | Tragic 82.0% |
| Blackfeet | 0.0 /100 | #310 | Tragic 81.9% |
| Colville | 0.0 /100 | #311 | Tragic 81.7% |
| Alaska Natives | 0.0 /100 | #312 | Tragic 81.6% |
| Mexicans | 0.0 /100 | #313 | Tragic 81.6% |
| Cajuns | 0.0 /100 | #314 | Tragic 81.5% |
| Immigrants | Mexico | 0.0 /100 | #315 | Tragic 81.5% |
| Comanche | 0.0 /100 | #316 | Tragic 81.5% |