Immigrants from Bangladesh vs Comanche In Labor Force | Age 35-44
COMPARE
Immigrants from Bangladesh
Comanche
In Labor Force | Age 35-44
In Labor Force | Age 35-44 Comparison
Immigrants from Bangladesh
Comanche
82.9%
IN LABOR FORCE | AGE 35-44
0.0/ 100
METRIC RATING
286th/ 347
METRIC RANK
81.5%
IN LABOR FORCE | AGE 35-44
0.0/ 100
METRIC RATING
316th/ 347
METRIC RANK
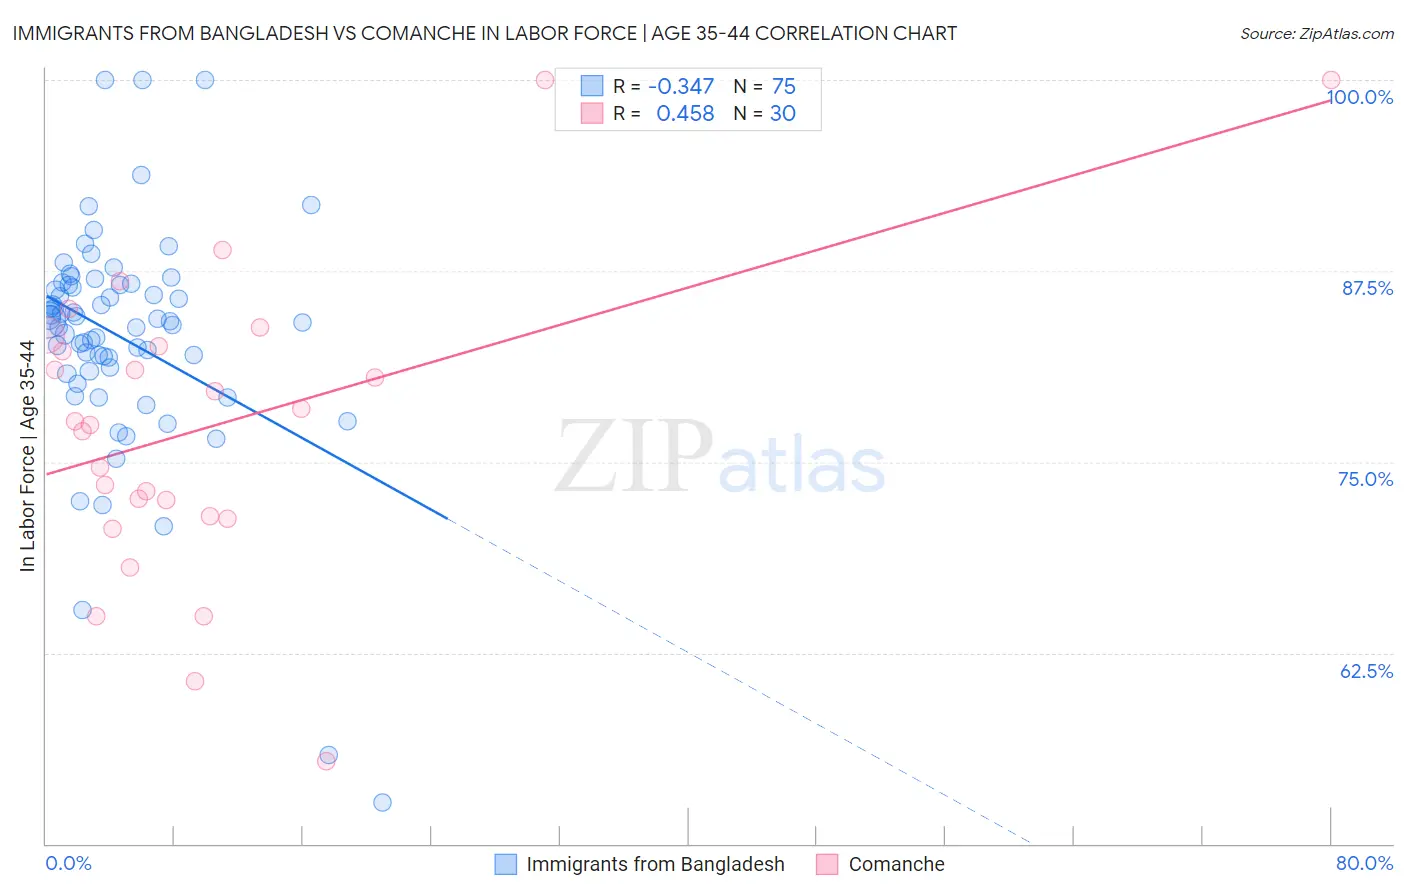
Immigrants from Bangladesh vs Comanche In Labor Force | Age 35-44 Correlation Chart
The statistical analysis conducted on geographies consisting of 203,615,335 people shows a mild negative correlation between the proportion of Immigrants from Bangladesh and labor force participation rate among population between the ages 35 and 44 in the United States with a correlation coefficient (R) of -0.347 and weighted average of 82.9%. Similarly, the statistical analysis conducted on geographies consisting of 109,773,192 people shows a moderate positive correlation between the proportion of Comanche and labor force participation rate among population between the ages 35 and 44 in the United States with a correlation coefficient (R) of 0.458 and weighted average of 81.5%, a difference of 1.8%.
In Labor Force | Age 35-44 Correlation Summary
| Measurement | Immigrants from Bangladesh | Comanche |
| Minimum | 52.7% | 55.4% |
| Maximum | 100.0% | 100.0% |
| Range | 47.3% | 44.6% |
| Mean | 83.1% | 77.3% |
| Median | 84.2% | 77.6% |
| Interquartile 25% (IQ1) | 81.0% | 71.4% |
| Interquartile 75% (IQ3) | 86.6% | 82.6% |
| Interquartile Range (IQR) | 5.6% | 11.2% |
| Standard Deviation (Sample) | 7.6% | 9.9% |
| Standard Deviation (Population) | 7.5% | 9.7% |
Similar Demographics by In Labor Force | Age 35-44
Demographics Similar to Immigrants from Bangladesh by In Labor Force | Age 35-44
In terms of in labor force | age 35-44, the demographic groups most similar to Immigrants from Bangladesh are Fijian (82.9%, a difference of 0.0%), Immigrants from Belize (82.9%, a difference of 0.0%), Immigrants from Dominican Republic (82.9%, a difference of 0.010%), Osage (82.9%, a difference of 0.020%), and Immigrants from Guatemala (82.9%, a difference of 0.020%).
| Demographics | Rating | Rank | In Labor Force | Age 35-44 |
| Immigrants | Micronesia | 0.0 /100 | #279 | Tragic 83.1% |
| Dominicans | 0.0 /100 | #280 | Tragic 83.1% |
| Guatemalans | 0.0 /100 | #281 | Tragic 83.0% |
| Osage | 0.0 /100 | #282 | Tragic 82.9% |
| Immigrants | Guatemala | 0.0 /100 | #283 | Tragic 82.9% |
| Immigrants | Dominican Republic | 0.0 /100 | #284 | Tragic 82.9% |
| Fijians | 0.0 /100 | #285 | Tragic 82.9% |
| Immigrants | Bangladesh | 0.0 /100 | #286 | Tragic 82.9% |
| Immigrants | Belize | 0.0 /100 | #287 | Tragic 82.9% |
| Puget Sound Salish | 0.0 /100 | #288 | Tragic 82.9% |
| Chippewa | 0.0 /100 | #289 | Tragic 82.9% |
| Africans | 0.0 /100 | #290 | Tragic 82.9% |
| Pennsylvania Germans | 0.0 /100 | #291 | Tragic 82.9% |
| Immigrants | Latin America | 0.0 /100 | #292 | Tragic 82.8% |
| Spanish Americans | 0.0 /100 | #293 | Tragic 82.8% |
Demographics Similar to Comanche by In Labor Force | Age 35-44
In terms of in labor force | age 35-44, the demographic groups most similar to Comanche are Immigrants from Mexico (81.5%, a difference of 0.020%), Cajun (81.5%, a difference of 0.050%), Cherokee (81.4%, a difference of 0.080%), Alaska Native (81.6%, a difference of 0.16%), and Mexican (81.6%, a difference of 0.16%).
| Demographics | Rating | Rank | In Labor Force | Age 35-44 |
| Cree | 0.0 /100 | #309 | Tragic 82.0% |
| Blackfeet | 0.0 /100 | #310 | Tragic 81.9% |
| Colville | 0.0 /100 | #311 | Tragic 81.7% |
| Alaska Natives | 0.0 /100 | #312 | Tragic 81.6% |
| Mexicans | 0.0 /100 | #313 | Tragic 81.6% |
| Cajuns | 0.0 /100 | #314 | Tragic 81.5% |
| Immigrants | Mexico | 0.0 /100 | #315 | Tragic 81.5% |
| Comanche | 0.0 /100 | #316 | Tragic 81.5% |
| Cherokee | 0.0 /100 | #317 | Tragic 81.4% |
| Alaskan Athabascans | 0.0 /100 | #318 | Tragic 81.3% |
| Inupiat | 0.0 /100 | #319 | Tragic 80.9% |
| Chickasaw | 0.0 /100 | #320 | Tragic 80.9% |
| Puerto Ricans | 0.0 /100 | #321 | Tragic 80.7% |
| Paiute | 0.0 /100 | #322 | Tragic 80.6% |
| Yaqui | 0.0 /100 | #323 | Tragic 80.5% |