English vs Hmong In Labor Force | Age 16-19
COMPARE
English
Hmong
In Labor Force | Age 16-19
In Labor Force | Age 16-19 Comparison
English
Hmong
42.4%
IN LABOR FORCE | AGE 16-19
100.0/ 100
METRIC RATING
26th/ 347
METRIC RANK
38.7%
IN LABOR FORCE | AGE 16-19
99.1/ 100
METRIC RATING
101st/ 347
METRIC RANK
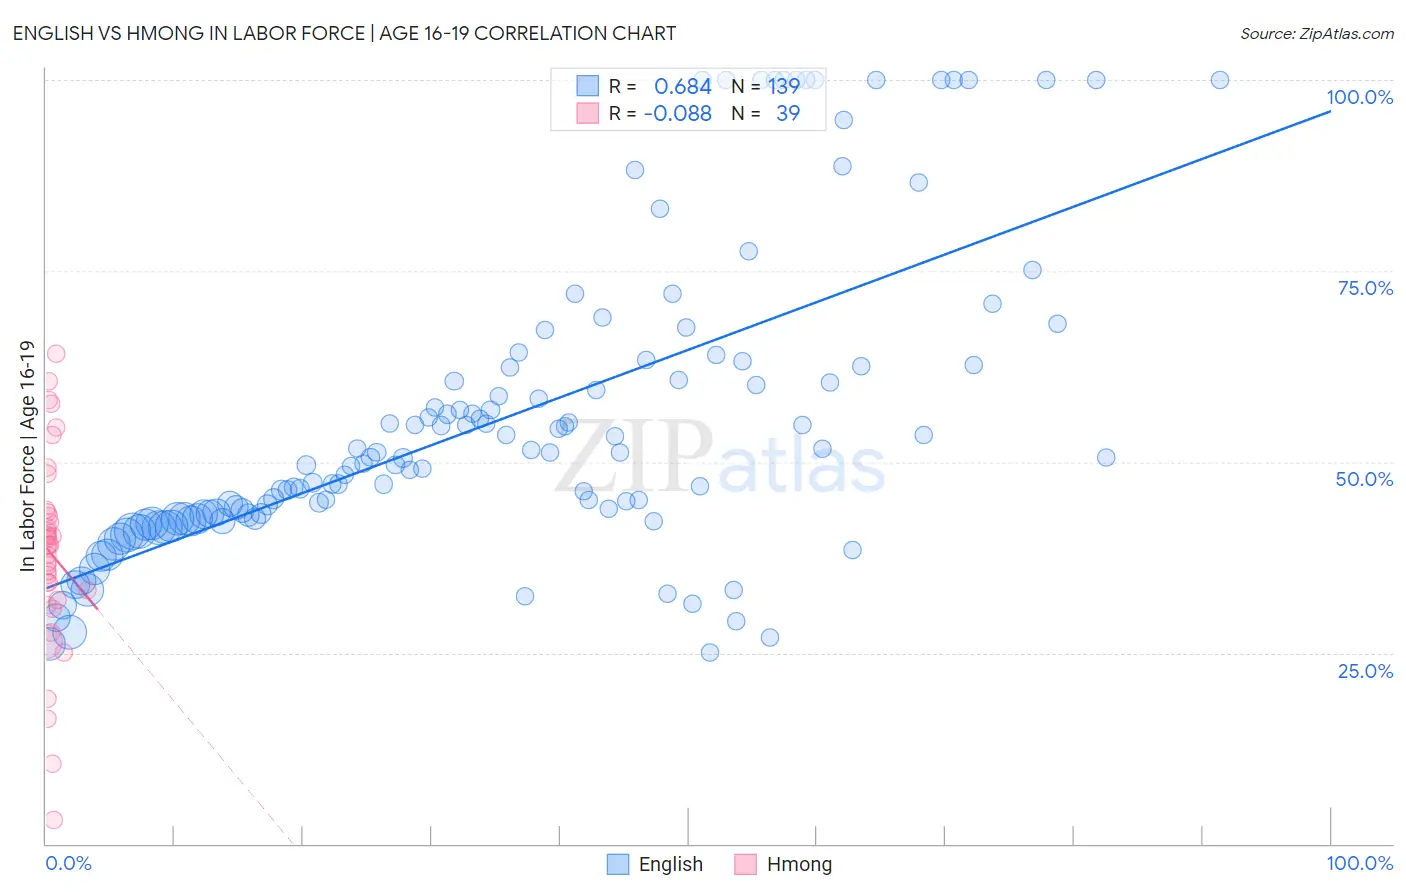
English vs Hmong In Labor Force | Age 16-19 Correlation Chart
The statistical analysis conducted on geographies consisting of 574,065,457 people shows a significant positive correlation between the proportion of English and labor force participation rate among population between the ages 16 and 19 in the United States with a correlation coefficient (R) of 0.684 and weighted average of 42.4%. Similarly, the statistical analysis conducted on geographies consisting of 24,681,034 people shows a slight negative correlation between the proportion of Hmong and labor force participation rate among population between the ages 16 and 19 in the United States with a correlation coefficient (R) of -0.088 and weighted average of 38.7%, a difference of 9.4%.
In Labor Force | Age 16-19 Correlation Summary
| Measurement | English | Hmong |
| Minimum | 25.0% | 3.1% |
| Maximum | 100.0% | 64.2% |
| Range | 75.0% | 61.1% |
| Mean | 55.8% | 38.1% |
| Median | 50.5% | 39.1% |
| Interquartile 25% (IQ1) | 42.6% | 31.9% |
| Interquartile 75% (IQ3) | 62.5% | 43.4% |
| Interquartile Range (IQR) | 19.9% | 11.5% |
| Standard Deviation (Sample) | 19.9% | 12.9% |
| Standard Deviation (Population) | 19.8% | 12.7% |
Similar Demographics by In Labor Force | Age 16-19
Demographics Similar to English by In Labor Force | Age 16-19
In terms of in labor force | age 16-19, the demographic groups most similar to English are German Russian (42.4%, a difference of 0.13%), Bangladeshi (42.5%, a difference of 0.21%), Welsh (42.3%, a difference of 0.28%), Slovak (42.6%, a difference of 0.54%), and Polish (42.1%, a difference of 0.57%).
| Demographics | Rating | Rank | In Labor Force | Age 16-19 |
| Belgians | 100.0 /100 | #19 | Exceptional 43.4% |
| Swiss | 100.0 /100 | #20 | Exceptional 43.3% |
| Ottawa | 100.0 /100 | #21 | Exceptional 43.0% |
| Sudanese | 100.0 /100 | #22 | Exceptional 42.9% |
| Slovaks | 100.0 /100 | #23 | Exceptional 42.6% |
| Bangladeshis | 100.0 /100 | #24 | Exceptional 42.5% |
| German Russians | 100.0 /100 | #25 | Exceptional 42.4% |
| English | 100.0 /100 | #26 | Exceptional 42.4% |
| Welsh | 100.0 /100 | #27 | Exceptional 42.3% |
| Poles | 100.0 /100 | #28 | Exceptional 42.1% |
| French | 100.0 /100 | #29 | Exceptional 42.1% |
| Scottish | 100.0 /100 | #30 | Exceptional 42.0% |
| Irish | 100.0 /100 | #31 | Exceptional 42.0% |
| Czechoslovakians | 100.0 /100 | #32 | Exceptional 41.9% |
| Liberians | 100.0 /100 | #33 | Exceptional 41.8% |
Demographics Similar to Hmong by In Labor Force | Age 16-19
In terms of in labor force | age 16-19, the demographic groups most similar to Hmong are Zimbabwean (38.7%, a difference of 0.010%), Immigrants from Cameroon (38.7%, a difference of 0.040%), Immigrants from Thailand (38.7%, a difference of 0.070%), Immigrants from Eritrea (38.7%, a difference of 0.090%), and Iraqi (38.6%, a difference of 0.25%).
| Demographics | Rating | Rank | In Labor Force | Age 16-19 |
| Immigrants | Canada | 99.4 /100 | #94 | Exceptional 38.9% |
| Immigrants | North America | 99.4 /100 | #95 | Exceptional 38.9% |
| Latvians | 99.4 /100 | #96 | Exceptional 38.9% |
| Greeks | 99.3 /100 | #97 | Exceptional 38.9% |
| Ugandans | 99.3 /100 | #98 | Exceptional 38.9% |
| Immigrants | North Macedonia | 99.3 /100 | #99 | Exceptional 38.9% |
| Immigrants | Thailand | 99.1 /100 | #100 | Exceptional 38.7% |
| Hmong | 99.1 /100 | #101 | Exceptional 38.7% |
| Zimbabweans | 99.1 /100 | #102 | Exceptional 38.7% |
| Immigrants | Cameroon | 99.0 /100 | #103 | Exceptional 38.7% |
| Immigrants | Eritrea | 99.0 /100 | #104 | Exceptional 38.7% |
| Iraqis | 98.9 /100 | #105 | Exceptional 38.6% |
| Delaware | 98.8 /100 | #106 | Exceptional 38.6% |
| Chinese | 98.8 /100 | #107 | Exceptional 38.6% |
| Immigrants | Ethiopia | 98.7 /100 | #108 | Exceptional 38.6% |