English vs Barbadian In Labor Force | Age 16-19
COMPARE
English
Barbadian
In Labor Force | Age 16-19
In Labor Force | Age 16-19 Comparison
English
Barbadians
42.4%
IN LABOR FORCE | AGE 16-19
100.0/ 100
METRIC RATING
26th/ 347
METRIC RANK
31.0%
IN LABOR FORCE | AGE 16-19
0.0/ 100
METRIC RATING
329th/ 347
METRIC RANK
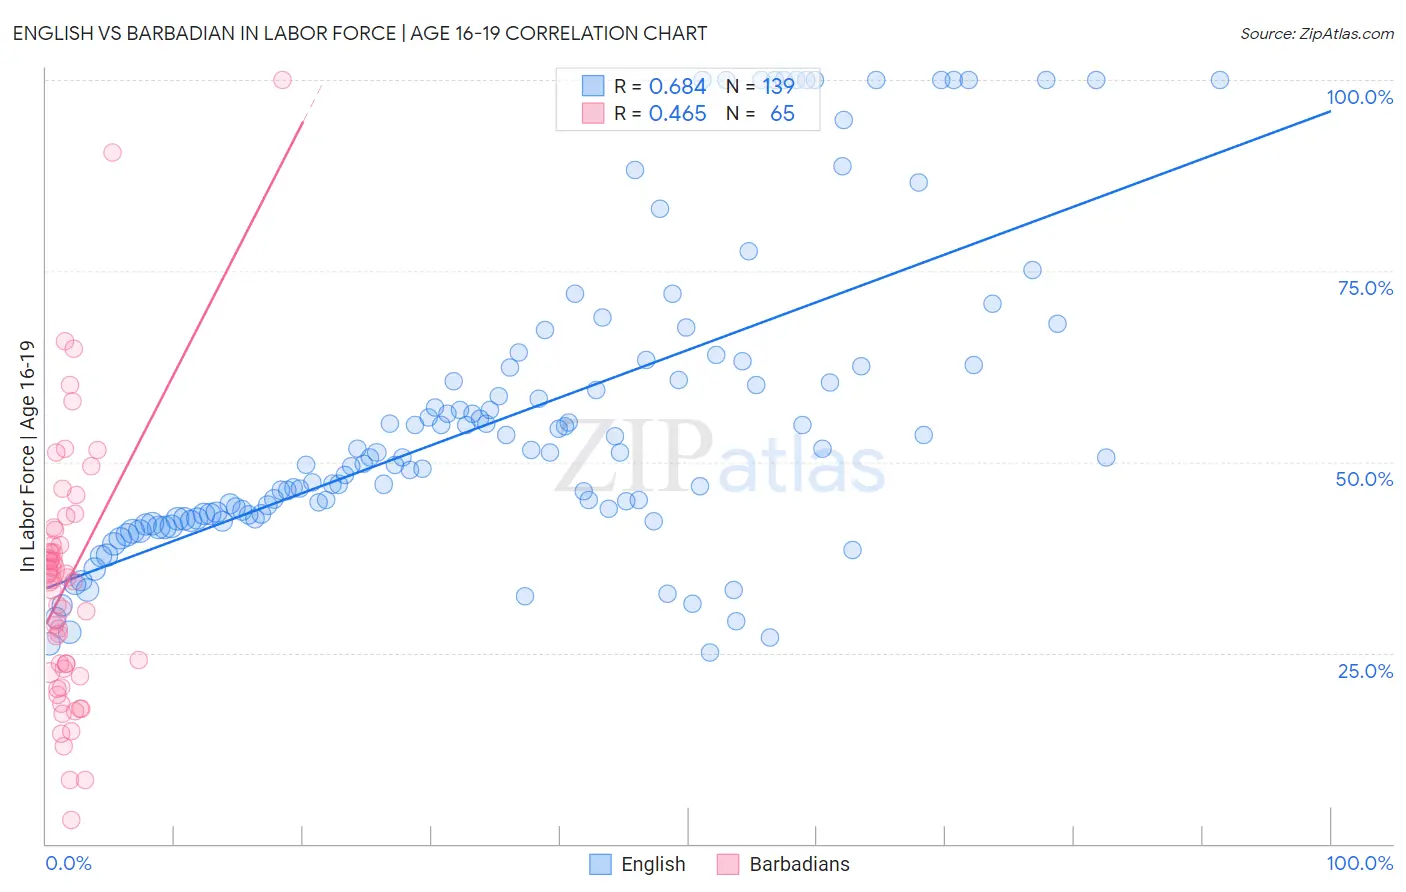
English vs Barbadian In Labor Force | Age 16-19 Correlation Chart
The statistical analysis conducted on geographies consisting of 574,065,457 people shows a significant positive correlation between the proportion of English and labor force participation rate among population between the ages 16 and 19 in the United States with a correlation coefficient (R) of 0.684 and weighted average of 42.4%. Similarly, the statistical analysis conducted on geographies consisting of 141,232,265 people shows a moderate positive correlation between the proportion of Barbadians and labor force participation rate among population between the ages 16 and 19 in the United States with a correlation coefficient (R) of 0.465 and weighted average of 31.0%, a difference of 36.7%.
In Labor Force | Age 16-19 Correlation Summary
| Measurement | English | Barbadian |
| Minimum | 25.0% | 3.1% |
| Maximum | 100.0% | 100.0% |
| Range | 75.0% | 96.9% |
| Mean | 55.8% | 34.4% |
| Median | 50.5% | 34.6% |
| Interquartile 25% (IQ1) | 42.6% | 22.6% |
| Interquartile 75% (IQ3) | 62.5% | 40.1% |
| Interquartile Range (IQR) | 19.9% | 17.4% |
| Standard Deviation (Sample) | 19.9% | 17.3% |
| Standard Deviation (Population) | 19.8% | 17.1% |
Similar Demographics by In Labor Force | Age 16-19
Demographics Similar to English by In Labor Force | Age 16-19
In terms of in labor force | age 16-19, the demographic groups most similar to English are German Russian (42.4%, a difference of 0.13%), Bangladeshi (42.5%, a difference of 0.21%), Welsh (42.3%, a difference of 0.28%), Slovak (42.6%, a difference of 0.54%), and Polish (42.1%, a difference of 0.57%).
| Demographics | Rating | Rank | In Labor Force | Age 16-19 |
| Belgians | 100.0 /100 | #19 | Exceptional 43.4% |
| Swiss | 100.0 /100 | #20 | Exceptional 43.3% |
| Ottawa | 100.0 /100 | #21 | Exceptional 43.0% |
| Sudanese | 100.0 /100 | #22 | Exceptional 42.9% |
| Slovaks | 100.0 /100 | #23 | Exceptional 42.6% |
| Bangladeshis | 100.0 /100 | #24 | Exceptional 42.5% |
| German Russians | 100.0 /100 | #25 | Exceptional 42.4% |
| English | 100.0 /100 | #26 | Exceptional 42.4% |
| Welsh | 100.0 /100 | #27 | Exceptional 42.3% |
| Poles | 100.0 /100 | #28 | Exceptional 42.1% |
| French | 100.0 /100 | #29 | Exceptional 42.1% |
| Scottish | 100.0 /100 | #30 | Exceptional 42.0% |
| Irish | 100.0 /100 | #31 | Exceptional 42.0% |
| Czechoslovakians | 100.0 /100 | #32 | Exceptional 41.9% |
| Liberians | 100.0 /100 | #33 | Exceptional 41.8% |
Demographics Similar to Barbadians by In Labor Force | Age 16-19
In terms of in labor force | age 16-19, the demographic groups most similar to Barbadians are Immigrants from Ecuador (31.0%, a difference of 0.030%), Immigrants from Taiwan (31.0%, a difference of 0.070%), Lumbee (31.0%, a difference of 0.12%), Immigrants from Dominican Republic (31.1%, a difference of 0.23%), and Trinidadian and Tobagonian (30.9%, a difference of 0.27%).
| Demographics | Rating | Rank | In Labor Force | Age 16-19 |
| Tohono O'odham | 0.0 /100 | #322 | Tragic 31.3% |
| Immigrants | Caribbean | 0.0 /100 | #323 | Tragic 31.2% |
| Dominicans | 0.0 /100 | #324 | Tragic 31.2% |
| Immigrants | China | 0.0 /100 | #325 | Tragic 31.1% |
| Immigrants | Dominican Republic | 0.0 /100 | #326 | Tragic 31.1% |
| Immigrants | Taiwan | 0.0 /100 | #327 | Tragic 31.0% |
| Immigrants | Ecuador | 0.0 /100 | #328 | Tragic 31.0% |
| Barbadians | 0.0 /100 | #329 | Tragic 31.0% |
| Lumbee | 0.0 /100 | #330 | Tragic 31.0% |
| Trinidadians and Tobagonians | 0.0 /100 | #331 | Tragic 30.9% |
| Immigrants | Israel | 0.0 /100 | #332 | Tragic 30.5% |
| Immigrants | Hong Kong | 0.0 /100 | #333 | Tragic 30.5% |
| Puerto Ricans | 0.0 /100 | #334 | Tragic 30.3% |
| Immigrants | Cuba | 0.0 /100 | #335 | Tragic 30.2% |
| Immigrants | Trinidad and Tobago | 0.0 /100 | #336 | Tragic 30.2% |