English vs African In Labor Force | Age 16-19
COMPARE
English
African
In Labor Force | Age 16-19
In Labor Force | Age 16-19 Comparison
English
Africans
42.4%
IN LABOR FORCE | AGE 16-19
100.0/ 100
METRIC RATING
26th/ 347
METRIC RANK
38.0%
IN LABOR FORCE | AGE 16-19
95.6/ 100
METRIC RATING
126th/ 347
METRIC RANK
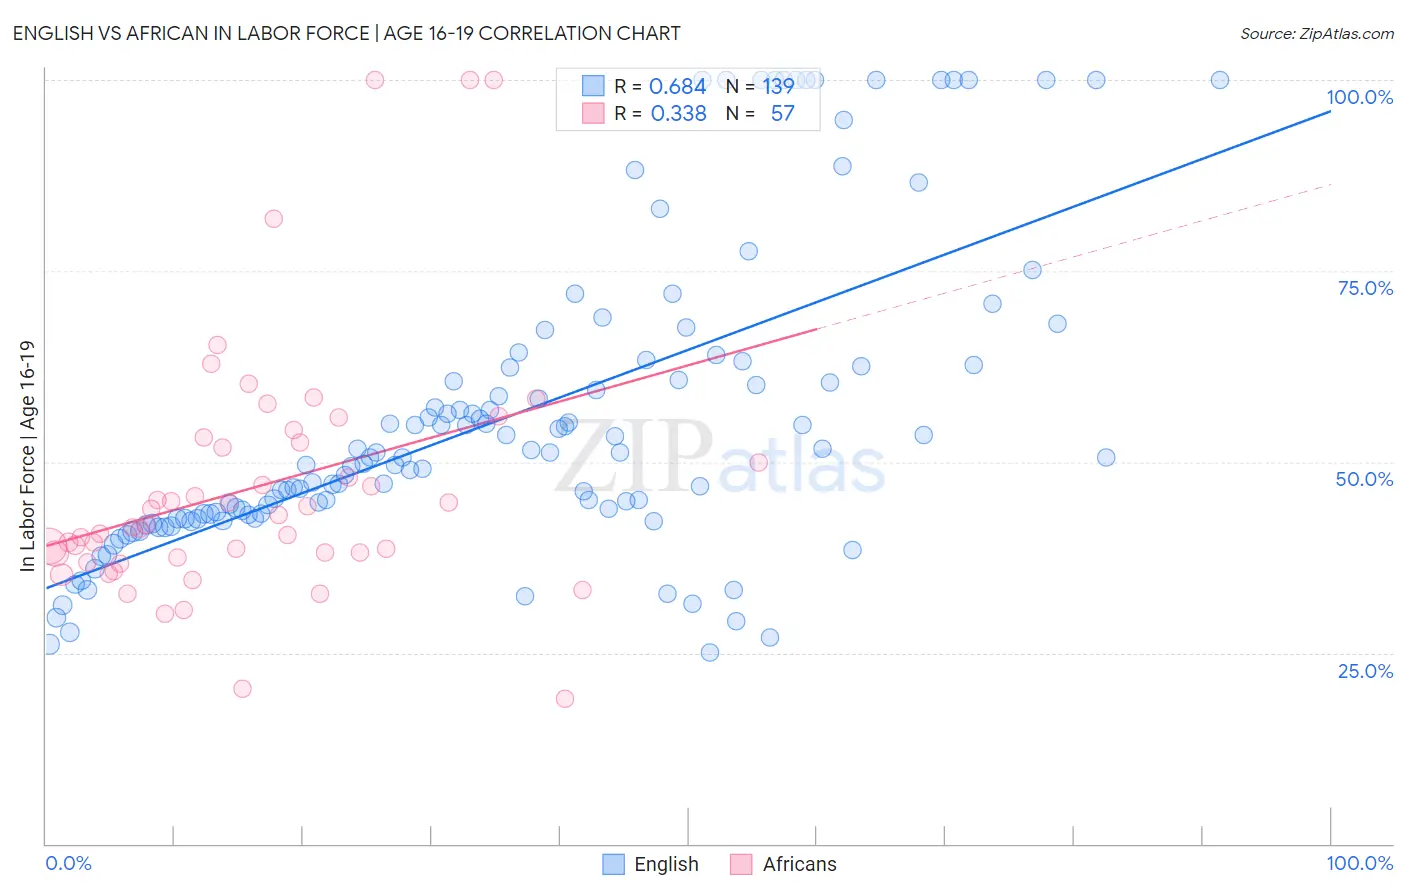
English vs African In Labor Force | Age 16-19 Correlation Chart
The statistical analysis conducted on geographies consisting of 574,065,457 people shows a significant positive correlation between the proportion of English and labor force participation rate among population between the ages 16 and 19 in the United States with a correlation coefficient (R) of 0.684 and weighted average of 42.4%. Similarly, the statistical analysis conducted on geographies consisting of 469,169,744 people shows a mild positive correlation between the proportion of Africans and labor force participation rate among population between the ages 16 and 19 in the United States with a correlation coefficient (R) of 0.338 and weighted average of 38.0%, a difference of 11.6%.
In Labor Force | Age 16-19 Correlation Summary
| Measurement | English | African |
| Minimum | 25.0% | 19.0% |
| Maximum | 100.0% | 100.0% |
| Range | 75.0% | 81.0% |
| Mean | 55.8% | 46.7% |
| Median | 50.5% | 41.8% |
| Interquartile 25% (IQ1) | 42.6% | 37.8% |
| Interquartile 75% (IQ3) | 62.5% | 52.9% |
| Interquartile Range (IQR) | 19.9% | 15.1% |
| Standard Deviation (Sample) | 19.9% | 16.6% |
| Standard Deviation (Population) | 19.8% | 16.5% |
Similar Demographics by In Labor Force | Age 16-19
Demographics Similar to English by In Labor Force | Age 16-19
In terms of in labor force | age 16-19, the demographic groups most similar to English are German Russian (42.4%, a difference of 0.13%), Bangladeshi (42.5%, a difference of 0.21%), Welsh (42.3%, a difference of 0.28%), Slovak (42.6%, a difference of 0.54%), and Polish (42.1%, a difference of 0.57%).
| Demographics | Rating | Rank | In Labor Force | Age 16-19 |
| Belgians | 100.0 /100 | #19 | Exceptional 43.4% |
| Swiss | 100.0 /100 | #20 | Exceptional 43.3% |
| Ottawa | 100.0 /100 | #21 | Exceptional 43.0% |
| Sudanese | 100.0 /100 | #22 | Exceptional 42.9% |
| Slovaks | 100.0 /100 | #23 | Exceptional 42.6% |
| Bangladeshis | 100.0 /100 | #24 | Exceptional 42.5% |
| German Russians | 100.0 /100 | #25 | Exceptional 42.4% |
| English | 100.0 /100 | #26 | Exceptional 42.4% |
| Welsh | 100.0 /100 | #27 | Exceptional 42.3% |
| Poles | 100.0 /100 | #28 | Exceptional 42.1% |
| French | 100.0 /100 | #29 | Exceptional 42.1% |
| Scottish | 100.0 /100 | #30 | Exceptional 42.0% |
| Irish | 100.0 /100 | #31 | Exceptional 42.0% |
| Czechoslovakians | 100.0 /100 | #32 | Exceptional 41.9% |
| Liberians | 100.0 /100 | #33 | Exceptional 41.8% |
Demographics Similar to Africans by In Labor Force | Age 16-19
In terms of in labor force | age 16-19, the demographic groups most similar to Africans are Choctaw (38.0%, a difference of 0.010%), New Zealander (38.0%, a difference of 0.010%), Spaniard (38.0%, a difference of 0.030%), Immigrants from Zimbabwe (38.0%, a difference of 0.060%), and Immigrants from Africa (38.0%, a difference of 0.16%).
| Demographics | Rating | Rank | In Labor Force | Age 16-19 |
| Assyrians/Chaldeans/Syriacs | 97.8 /100 | #119 | Exceptional 38.3% |
| Ukrainians | 97.6 /100 | #120 | Exceptional 38.3% |
| Ethiopians | 97.4 /100 | #121 | Exceptional 38.2% |
| Guamanians/Chamorros | 97.4 /100 | #122 | Exceptional 38.2% |
| Seminole | 96.7 /100 | #123 | Exceptional 38.1% |
| Immigrants | England | 96.4 /100 | #124 | Exceptional 38.1% |
| Immigrants | Africa | 96.1 /100 | #125 | Exceptional 38.0% |
| Africans | 95.6 /100 | #126 | Exceptional 38.0% |
| Choctaw | 95.6 /100 | #127 | Exceptional 38.0% |
| New Zealanders | 95.6 /100 | #128 | Exceptional 38.0% |
| Spaniards | 95.5 /100 | #129 | Exceptional 38.0% |
| Immigrants | Zimbabwe | 95.4 /100 | #130 | Exceptional 38.0% |
| Immigrants | Austria | 95.0 /100 | #131 | Exceptional 37.9% |
| Immigrants | Oceania | 94.7 /100 | #132 | Exceptional 37.9% |
| Cheyenne | 94.6 /100 | #133 | Exceptional 37.9% |