English vs Immigrants from Bahamas In Labor Force | Age 16-19
COMPARE
English
Immigrants from Bahamas
In Labor Force | Age 16-19
In Labor Force | Age 16-19 Comparison
English
Immigrants from Bahamas
42.4%
IN LABOR FORCE | AGE 16-19
100.0/ 100
METRIC RATING
26th/ 347
METRIC RANK
35.5%
IN LABOR FORCE | AGE 16-19
8.3/ 100
METRIC RATING
220th/ 347
METRIC RANK
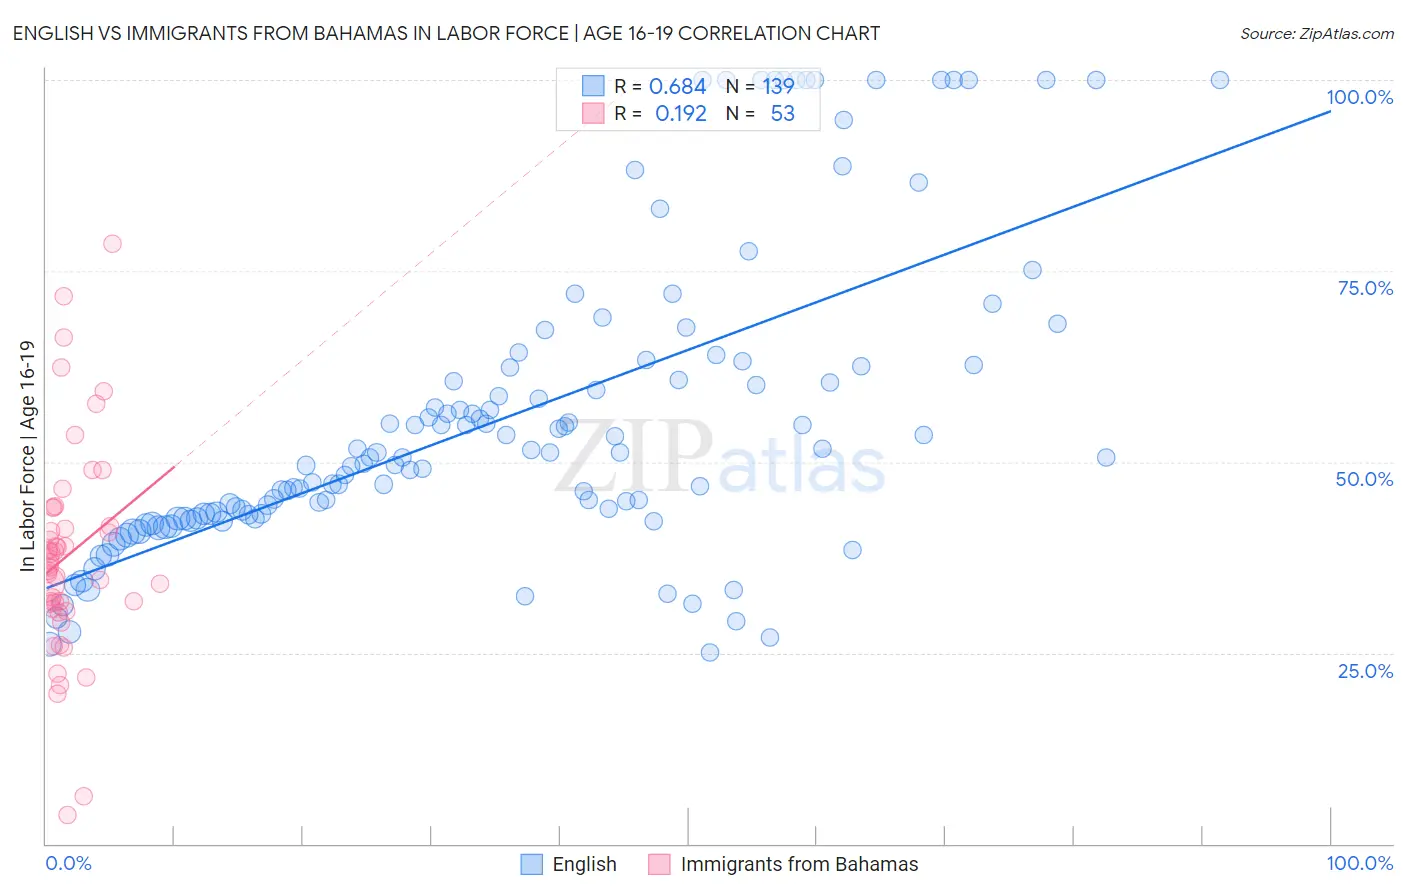
English vs Immigrants from Bahamas In Labor Force | Age 16-19 Correlation Chart
The statistical analysis conducted on geographies consisting of 574,065,457 people shows a significant positive correlation between the proportion of English and labor force participation rate among population between the ages 16 and 19 in the United States with a correlation coefficient (R) of 0.684 and weighted average of 42.4%. Similarly, the statistical analysis conducted on geographies consisting of 104,625,160 people shows a poor positive correlation between the proportion of Immigrants from Bahamas and labor force participation rate among population between the ages 16 and 19 in the United States with a correlation coefficient (R) of 0.192 and weighted average of 35.5%, a difference of 19.5%.
In Labor Force | Age 16-19 Correlation Summary
| Measurement | English | Immigrants from Bahamas |
| Minimum | 25.0% | 3.8% |
| Maximum | 100.0% | 78.5% |
| Range | 75.0% | 74.7% |
| Mean | 55.8% | 37.8% |
| Median | 50.5% | 36.7% |
| Interquartile 25% (IQ1) | 42.6% | 31.1% |
| Interquartile 75% (IQ3) | 62.5% | 42.7% |
| Interquartile Range (IQR) | 19.9% | 11.6% |
| Standard Deviation (Sample) | 19.9% | 13.9% |
| Standard Deviation (Population) | 19.8% | 13.7% |
Similar Demographics by In Labor Force | Age 16-19
Demographics Similar to English by In Labor Force | Age 16-19
In terms of in labor force | age 16-19, the demographic groups most similar to English are German Russian (42.4%, a difference of 0.13%), Bangladeshi (42.5%, a difference of 0.21%), Welsh (42.3%, a difference of 0.28%), Slovak (42.6%, a difference of 0.54%), and Polish (42.1%, a difference of 0.57%).
| Demographics | Rating | Rank | In Labor Force | Age 16-19 |
| Belgians | 100.0 /100 | #19 | Exceptional 43.4% |
| Swiss | 100.0 /100 | #20 | Exceptional 43.3% |
| Ottawa | 100.0 /100 | #21 | Exceptional 43.0% |
| Sudanese | 100.0 /100 | #22 | Exceptional 42.9% |
| Slovaks | 100.0 /100 | #23 | Exceptional 42.6% |
| Bangladeshis | 100.0 /100 | #24 | Exceptional 42.5% |
| German Russians | 100.0 /100 | #25 | Exceptional 42.4% |
| English | 100.0 /100 | #26 | Exceptional 42.4% |
| Welsh | 100.0 /100 | #27 | Exceptional 42.3% |
| Poles | 100.0 /100 | #28 | Exceptional 42.1% |
| French | 100.0 /100 | #29 | Exceptional 42.1% |
| Scottish | 100.0 /100 | #30 | Exceptional 42.0% |
| Irish | 100.0 /100 | #31 | Exceptional 42.0% |
| Czechoslovakians | 100.0 /100 | #32 | Exceptional 41.9% |
| Liberians | 100.0 /100 | #33 | Exceptional 41.8% |
Demographics Similar to Immigrants from Bahamas by In Labor Force | Age 16-19
In terms of in labor force | age 16-19, the demographic groups most similar to Immigrants from Bahamas are Guatemalan (35.5%, a difference of 0.060%), Turkish (35.4%, a difference of 0.18%), Immigrants from Ghana (35.4%, a difference of 0.19%), Sri Lankan (35.5%, a difference of 0.24%), and Ghanaian (35.3%, a difference of 0.33%).
| Demographics | Rating | Rank | In Labor Force | Age 16-19 |
| Immigrants | Bolivia | 11.0 /100 | #213 | Poor 35.6% |
| Apache | 11.0 /100 | #214 | Poor 35.6% |
| Immigrants | South Eastern Asia | 10.8 /100 | #215 | Poor 35.6% |
| Dutch West Indians | 10.7 /100 | #216 | Poor 35.6% |
| Immigrants | Costa Rica | 10.7 /100 | #217 | Poor 35.6% |
| Sri Lankans | 9.8 /100 | #218 | Tragic 35.5% |
| Guatemalans | 8.6 /100 | #219 | Tragic 35.5% |
| Immigrants | Bahamas | 8.3 /100 | #220 | Tragic 35.5% |
| Turks | 7.3 /100 | #221 | Tragic 35.4% |
| Immigrants | Ghana | 7.3 /100 | #222 | Tragic 35.4% |
| Ghanaians | 6.5 /100 | #223 | Tragic 35.3% |
| Hondurans | 6.5 /100 | #224 | Tragic 35.3% |
| Immigrants | Belgium | 6.1 /100 | #225 | Tragic 35.3% |
| Immigrants | Guatemala | 5.7 /100 | #226 | Tragic 35.3% |
| Mongolians | 5.7 /100 | #227 | Tragic 35.3% |