English vs Hmong Single Female Poverty
COMPARE
English
Hmong
Single Female Poverty
Single Female Poverty Comparison
English
Hmong
21.9%
SINGLE FEMALE POVERTY
6.4/ 100
METRIC RATING
225th/ 347
METRIC RANK
23.1%
SINGLE FEMALE POVERTY
0.2/ 100
METRIC RATING
269th/ 347
METRIC RANK
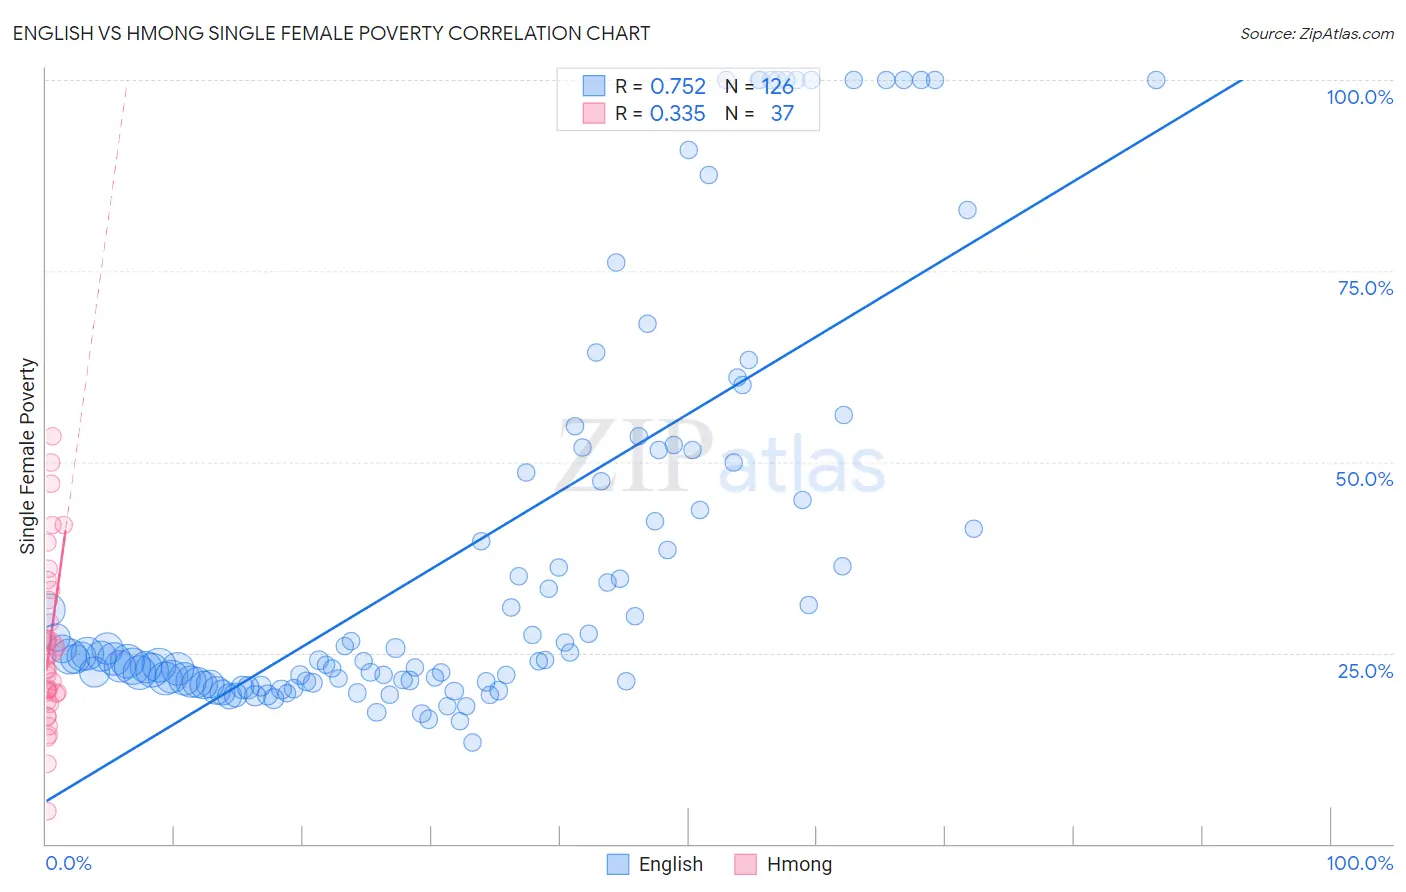
English vs Hmong Single Female Poverty Correlation Chart
The statistical analysis conducted on geographies consisting of 556,985,462 people shows a strong positive correlation between the proportion of English and poverty level among single females in the United States with a correlation coefficient (R) of 0.752 and weighted average of 21.9%. Similarly, the statistical analysis conducted on geographies consisting of 24,642,418 people shows a mild positive correlation between the proportion of Hmong and poverty level among single females in the United States with a correlation coefficient (R) of 0.335 and weighted average of 23.1%, a difference of 5.4%.
Single Female Poverty Correlation Summary
| Measurement | English | Hmong |
| Minimum | 13.3% | 4.3% |
| Maximum | 100.0% | 53.4% |
| Range | 86.7% | 49.1% |
| Mean | 38.4% | 25.8% |
| Median | 24.4% | 22.9% |
| Interquartile 25% (IQ1) | 21.3% | 19.1% |
| Interquartile 75% (IQ3) | 48.5% | 32.5% |
| Interquartile Range (IQR) | 27.3% | 13.4% |
| Standard Deviation (Sample) | 26.6% | 11.0% |
| Standard Deviation (Population) | 26.5% | 10.9% |
Similar Demographics by Single Female Poverty
Demographics Similar to English by Single Female Poverty
In terms of single female poverty, the demographic groups most similar to English are Immigrants from Portugal (21.9%, a difference of 0.16%), Immigrants from Ghana (21.9%, a difference of 0.16%), Barbadian (21.8%, a difference of 0.18%), Scottish (21.8%, a difference of 0.20%), and Salvadoran (21.9%, a difference of 0.26%).
| Demographics | Rating | Rank | Single Female Poverty |
| Nepalese | 9.7 /100 | #218 | Tragic 21.7% |
| Panamanians | 9.4 /100 | #219 | Tragic 21.7% |
| Germans | 8.3 /100 | #220 | Tragic 21.8% |
| Immigrants | Grenada | 8.0 /100 | #221 | Tragic 21.8% |
| Immigrants | Eritrea | 7.9 /100 | #222 | Tragic 21.8% |
| Scottish | 7.3 /100 | #223 | Tragic 21.8% |
| Barbadians | 7.2 /100 | #224 | Tragic 21.8% |
| English | 6.4 /100 | #225 | Tragic 21.9% |
| Immigrants | Portugal | 5.8 /100 | #226 | Tragic 21.9% |
| Immigrants | Ghana | 5.8 /100 | #227 | Tragic 21.9% |
| Salvadorans | 5.5 /100 | #228 | Tragic 21.9% |
| Tlingit-Haida | 5.4 /100 | #229 | Tragic 21.9% |
| Immigrants | Western Africa | 5.3 /100 | #230 | Tragic 22.0% |
| Welsh | 5.0 /100 | #231 | Tragic 22.0% |
| Immigrants | Thailand | 5.0 /100 | #232 | Tragic 22.0% |
Demographics Similar to Hmong by Single Female Poverty
In terms of single female poverty, the demographic groups most similar to Hmong are Fijian (23.1%, a difference of 0.030%), Senegalese (23.0%, a difference of 0.10%), Immigrants from Micronesia (23.0%, a difference of 0.16%), Inupiat (23.1%, a difference of 0.26%), and Central American (23.0%, a difference of 0.37%).
| Demographics | Rating | Rank | Single Female Poverty |
| British West Indians | 0.4 /100 | #262 | Tragic 22.8% |
| Scotch-Irish | 0.3 /100 | #263 | Tragic 22.9% |
| Immigrants | Laos | 0.3 /100 | #264 | Tragic 22.9% |
| Central Americans | 0.2 /100 | #265 | Tragic 23.0% |
| Immigrants | Micronesia | 0.2 /100 | #266 | Tragic 23.0% |
| Senegalese | 0.2 /100 | #267 | Tragic 23.0% |
| Fijians | 0.2 /100 | #268 | Tragic 23.1% |
| Hmong | 0.2 /100 | #269 | Tragic 23.1% |
| Inupiat | 0.2 /100 | #270 | Tragic 23.1% |
| Sub-Saharan Africans | 0.1 /100 | #271 | Tragic 23.2% |
| Immigrants | Senegal | 0.1 /100 | #272 | Tragic 23.2% |
| Alaska Natives | 0.1 /100 | #273 | Tragic 23.3% |
| Marshallese | 0.1 /100 | #274 | Tragic 23.3% |
| Mexican American Indians | 0.1 /100 | #275 | Tragic 23.4% |
| Immigrants | Azores | 0.0 /100 | #276 | Tragic 23.5% |