English vs Cajun In Labor Force | Age 16-19
COMPARE
English
Cajun
In Labor Force | Age 16-19
In Labor Force | Age 16-19 Comparison
English
Cajuns
42.4%
IN LABOR FORCE | AGE 16-19
100.0/ 100
METRIC RATING
26th/ 347
METRIC RANK
37.8%
IN LABOR FORCE | AGE 16-19
93.2/ 100
METRIC RATING
137th/ 347
METRIC RANK
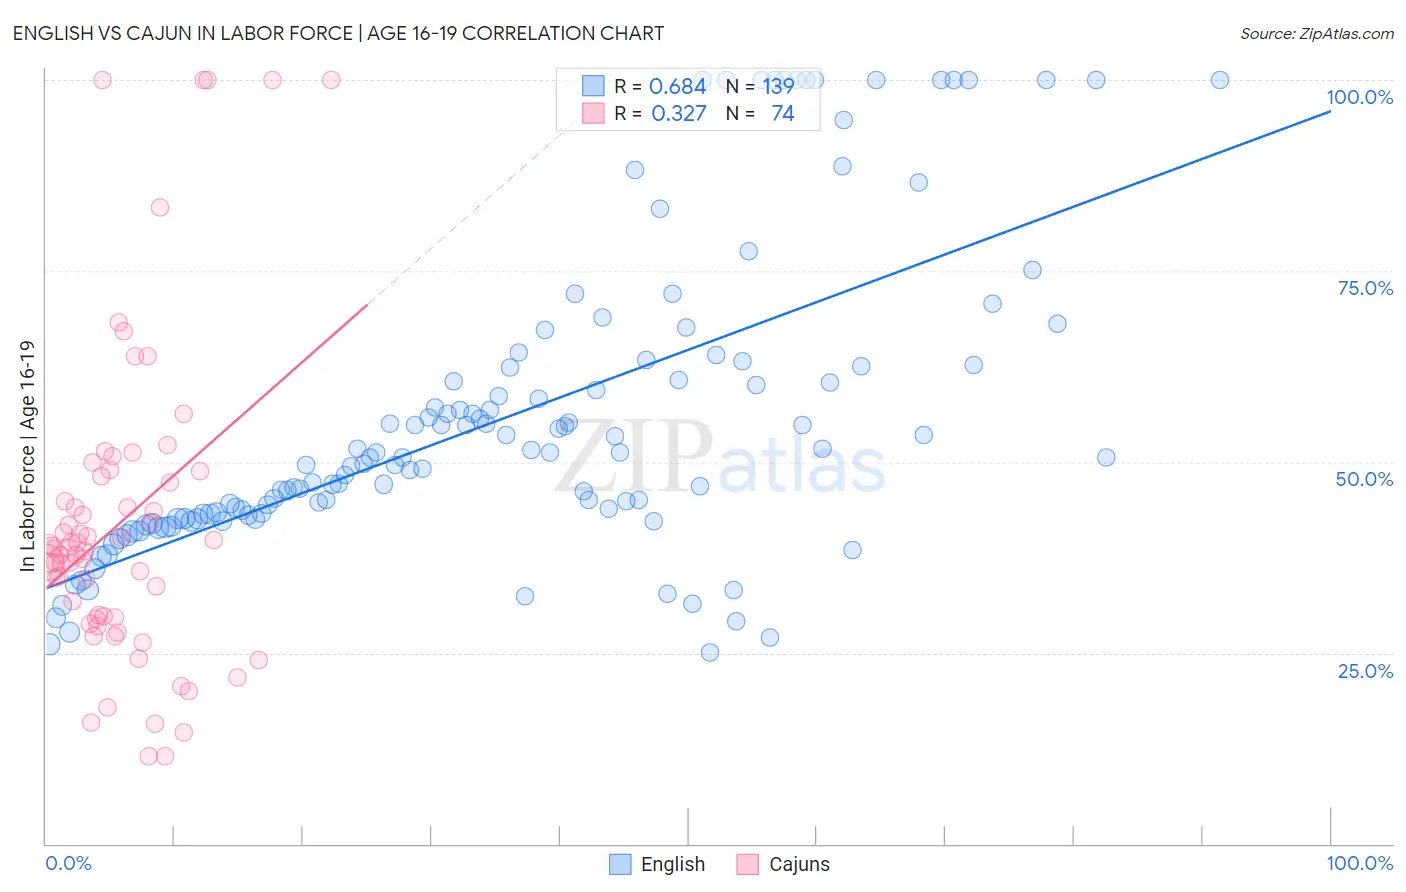
English vs Cajun In Labor Force | Age 16-19 Correlation Chart
The statistical analysis conducted on geographies consisting of 574,065,457 people shows a significant positive correlation between the proportion of English and labor force participation rate among population between the ages 16 and 19 in the United States with a correlation coefficient (R) of 0.684 and weighted average of 42.4%. Similarly, the statistical analysis conducted on geographies consisting of 149,548,332 people shows a mild positive correlation between the proportion of Cajuns and labor force participation rate among population between the ages 16 and 19 in the United States with a correlation coefficient (R) of 0.327 and weighted average of 37.8%, a difference of 12.2%.
In Labor Force | Age 16-19 Correlation Summary
| Measurement | English | Cajun |
| Minimum | 25.0% | 11.5% |
| Maximum | 100.0% | 100.0% |
| Range | 75.0% | 88.5% |
| Mean | 55.8% | 42.1% |
| Median | 50.5% | 38.7% |
| Interquartile 25% (IQ1) | 42.6% | 29.6% |
| Interquartile 75% (IQ3) | 62.5% | 48.1% |
| Interquartile Range (IQR) | 19.9% | 18.5% |
| Standard Deviation (Sample) | 19.9% | 20.5% |
| Standard Deviation (Population) | 19.8% | 20.3% |
Similar Demographics by In Labor Force | Age 16-19
Demographics Similar to English by In Labor Force | Age 16-19
In terms of in labor force | age 16-19, the demographic groups most similar to English are German Russian (42.4%, a difference of 0.13%), Bangladeshi (42.5%, a difference of 0.21%), Welsh (42.3%, a difference of 0.28%), Slovak (42.6%, a difference of 0.54%), and Polish (42.1%, a difference of 0.57%).
| Demographics | Rating | Rank | In Labor Force | Age 16-19 |
| Belgians | 100.0 /100 | #19 | Exceptional 43.4% |
| Swiss | 100.0 /100 | #20 | Exceptional 43.3% |
| Ottawa | 100.0 /100 | #21 | Exceptional 43.0% |
| Sudanese | 100.0 /100 | #22 | Exceptional 42.9% |
| Slovaks | 100.0 /100 | #23 | Exceptional 42.6% |
| Bangladeshis | 100.0 /100 | #24 | Exceptional 42.5% |
| German Russians | 100.0 /100 | #25 | Exceptional 42.4% |
| English | 100.0 /100 | #26 | Exceptional 42.4% |
| Welsh | 100.0 /100 | #27 | Exceptional 42.3% |
| Poles | 100.0 /100 | #28 | Exceptional 42.1% |
| French | 100.0 /100 | #29 | Exceptional 42.1% |
| Scottish | 100.0 /100 | #30 | Exceptional 42.0% |
| Irish | 100.0 /100 | #31 | Exceptional 42.0% |
| Czechoslovakians | 100.0 /100 | #32 | Exceptional 41.9% |
| Liberians | 100.0 /100 | #33 | Exceptional 41.8% |
Demographics Similar to Cajuns by In Labor Force | Age 16-19
In terms of in labor force | age 16-19, the demographic groups most similar to Cajuns are Australian (37.8%, a difference of 0.0%), Macedonian (37.8%, a difference of 0.030%), Immigrants from Netherlands (37.8%, a difference of 0.090%), Comanche (37.7%, a difference of 0.23%), and Immigrants from Moldova (37.7%, a difference of 0.24%).
| Demographics | Rating | Rank | In Labor Force | Age 16-19 |
| Immigrants | Zimbabwe | 95.4 /100 | #130 | Exceptional 38.0% |
| Immigrants | Austria | 95.0 /100 | #131 | Exceptional 37.9% |
| Immigrants | Oceania | 94.7 /100 | #132 | Exceptional 37.9% |
| Cheyenne | 94.6 /100 | #133 | Exceptional 37.9% |
| Immigrants | Netherlands | 93.7 /100 | #134 | Exceptional 37.8% |
| Macedonians | 93.4 /100 | #135 | Exceptional 37.8% |
| Australians | 93.2 /100 | #136 | Exceptional 37.8% |
| Cajuns | 93.2 /100 | #137 | Exceptional 37.8% |
| Comanche | 91.9 /100 | #138 | Exceptional 37.7% |
| Immigrants | Moldova | 91.9 /100 | #139 | Exceptional 37.7% |
| Estonians | 91.7 /100 | #140 | Exceptional 37.7% |
| Syrians | 90.7 /100 | #141 | Exceptional 37.6% |
| Sierra Leoneans | 89.7 /100 | #142 | Excellent 37.6% |
| Pakistanis | 89.5 /100 | #143 | Excellent 37.6% |
| Japanese | 89.3 /100 | #144 | Excellent 37.5% |