Kiowa vs Hmong In Labor Force | Age 16-19
COMPARE
Kiowa
Hmong
In Labor Force | Age 16-19
In Labor Force | Age 16-19 Comparison
Kiowa
Hmong
37.2%
IN LABOR FORCE | AGE 16-19
80.4/ 100
METRIC RATING
156th/ 347
METRIC RANK
38.7%
IN LABOR FORCE | AGE 16-19
99.1/ 100
METRIC RATING
101st/ 347
METRIC RANK
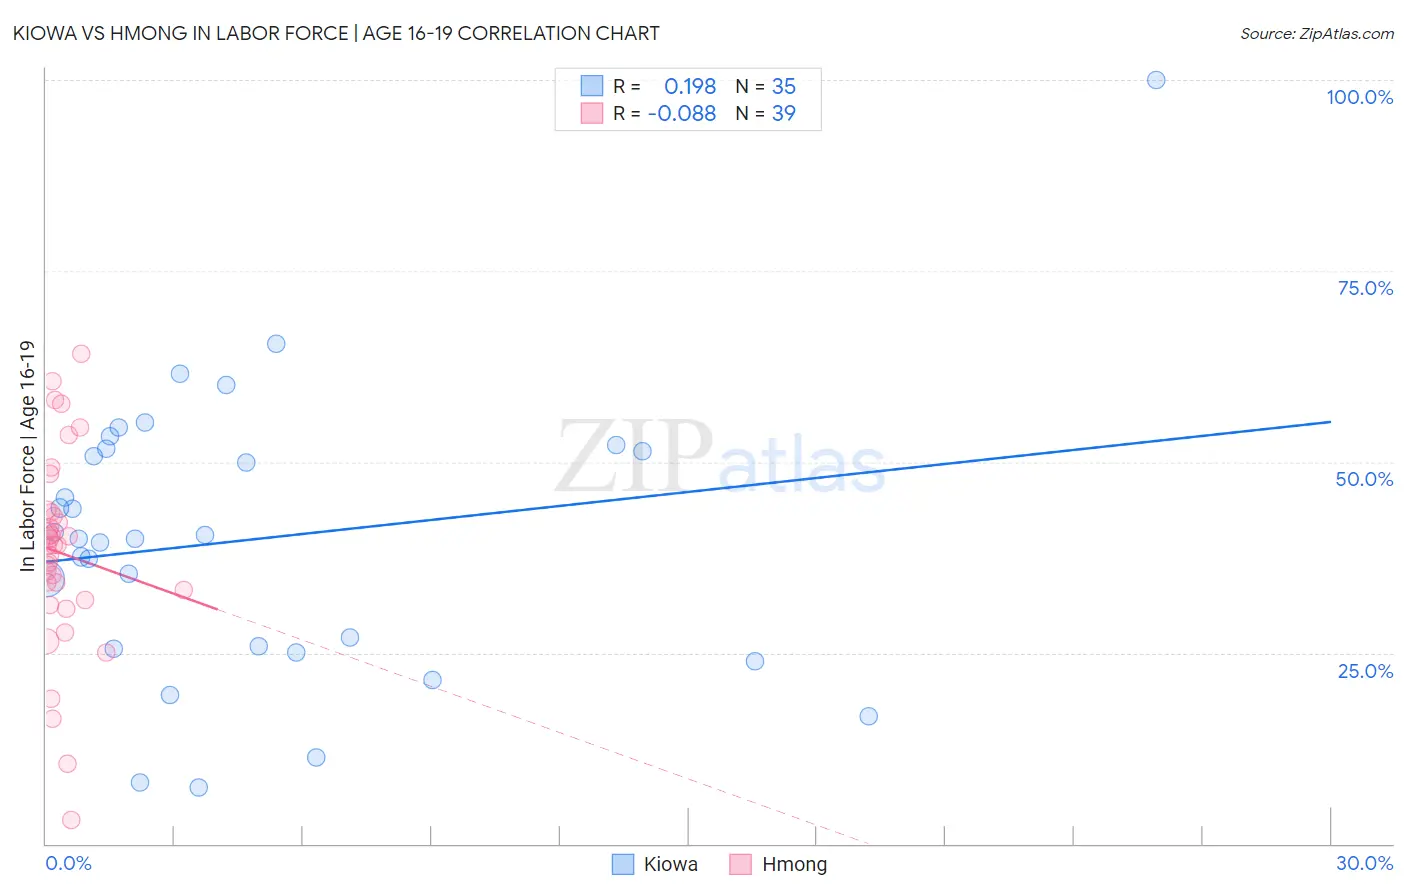
Kiowa vs Hmong In Labor Force | Age 16-19 Correlation Chart
The statistical analysis conducted on geographies consisting of 56,077,832 people shows a poor positive correlation between the proportion of Kiowa and labor force participation rate among population between the ages 16 and 19 in the United States with a correlation coefficient (R) of 0.198 and weighted average of 37.2%. Similarly, the statistical analysis conducted on geographies consisting of 24,681,034 people shows a slight negative correlation between the proportion of Hmong and labor force participation rate among population between the ages 16 and 19 in the United States with a correlation coefficient (R) of -0.088 and weighted average of 38.7%, a difference of 4.0%.
In Labor Force | Age 16-19 Correlation Summary
| Measurement | Kiowa | Hmong |
| Minimum | 7.4% | 3.1% |
| Maximum | 100.0% | 64.2% |
| Range | 92.6% | 61.1% |
| Mean | 39.9% | 38.1% |
| Median | 40.0% | 39.1% |
| Interquartile 25% (IQ1) | 25.5% | 31.9% |
| Interquartile 75% (IQ3) | 51.7% | 43.4% |
| Interquartile Range (IQR) | 26.2% | 11.5% |
| Standard Deviation (Sample) | 18.6% | 12.9% |
| Standard Deviation (Population) | 18.3% | 12.7% |
Similar Demographics by In Labor Force | Age 16-19
Demographics Similar to Kiowa by In Labor Force | Age 16-19
In terms of in labor force | age 16-19, the demographic groups most similar to Kiowa are Immigrants from Lithuania (37.2%, a difference of 0.020%), Immigrants from Bulgaria (37.3%, a difference of 0.10%), Arapaho (37.3%, a difference of 0.12%), Immigrants from Sierra Leone (37.3%, a difference of 0.27%), and Immigrants from Brazil (37.1%, a difference of 0.29%).
| Demographics | Rating | Rank | In Labor Force | Age 16-19 |
| Native Hawaiians | 85.0 /100 | #149 | Excellent 37.4% |
| Tsimshian | 84.7 /100 | #150 | Excellent 37.4% |
| Immigrants | Poland | 84.4 /100 | #151 | Excellent 37.3% |
| Immigrants | Sierra Leone | 83.6 /100 | #152 | Excellent 37.3% |
| Arapaho | 81.8 /100 | #153 | Excellent 37.3% |
| Immigrants | Bulgaria | 81.6 /100 | #154 | Excellent 37.3% |
| Immigrants | Lithuania | 80.7 /100 | #155 | Excellent 37.2% |
| Kiowa | 80.4 /100 | #156 | Excellent 37.2% |
| Immigrants | Brazil | 76.5 /100 | #157 | Good 37.1% |
| Ute | 75.7 /100 | #158 | Good 37.1% |
| Yaqui | 74.4 /100 | #159 | Good 37.1% |
| Immigrants | Saudi Arabia | 73.9 /100 | #160 | Good 37.0% |
| Cambodians | 71.5 /100 | #161 | Good 37.0% |
| Immigrants | Jordan | 69.5 /100 | #162 | Good 36.9% |
| Bermudans | 69.3 /100 | #163 | Good 36.9% |
Demographics Similar to Hmong by In Labor Force | Age 16-19
In terms of in labor force | age 16-19, the demographic groups most similar to Hmong are Zimbabwean (38.7%, a difference of 0.010%), Immigrants from Cameroon (38.7%, a difference of 0.040%), Immigrants from Thailand (38.7%, a difference of 0.070%), Immigrants from Eritrea (38.7%, a difference of 0.090%), and Iraqi (38.6%, a difference of 0.25%).
| Demographics | Rating | Rank | In Labor Force | Age 16-19 |
| Immigrants | Canada | 99.4 /100 | #94 | Exceptional 38.9% |
| Immigrants | North America | 99.4 /100 | #95 | Exceptional 38.9% |
| Latvians | 99.4 /100 | #96 | Exceptional 38.9% |
| Greeks | 99.3 /100 | #97 | Exceptional 38.9% |
| Ugandans | 99.3 /100 | #98 | Exceptional 38.9% |
| Immigrants | North Macedonia | 99.3 /100 | #99 | Exceptional 38.9% |
| Immigrants | Thailand | 99.1 /100 | #100 | Exceptional 38.7% |
| Hmong | 99.1 /100 | #101 | Exceptional 38.7% |
| Zimbabweans | 99.1 /100 | #102 | Exceptional 38.7% |
| Immigrants | Cameroon | 99.0 /100 | #103 | Exceptional 38.7% |
| Immigrants | Eritrea | 99.0 /100 | #104 | Exceptional 38.7% |
| Iraqis | 98.9 /100 | #105 | Exceptional 38.6% |
| Delaware | 98.8 /100 | #106 | Exceptional 38.6% |
| Chinese | 98.8 /100 | #107 | Exceptional 38.6% |
| Immigrants | Ethiopia | 98.7 /100 | #108 | Exceptional 38.6% |