Immigrants from Denmark vs Hmong In Labor Force | Age 16-19
COMPARE
Immigrants from Denmark
Hmong
In Labor Force | Age 16-19
In Labor Force | Age 16-19 Comparison
Immigrants from Denmark
Hmong
36.1%
IN LABOR FORCE | AGE 16-19
25.0/ 100
METRIC RATING
193rd/ 347
METRIC RANK
38.7%
IN LABOR FORCE | AGE 16-19
99.1/ 100
METRIC RATING
101st/ 347
METRIC RANK
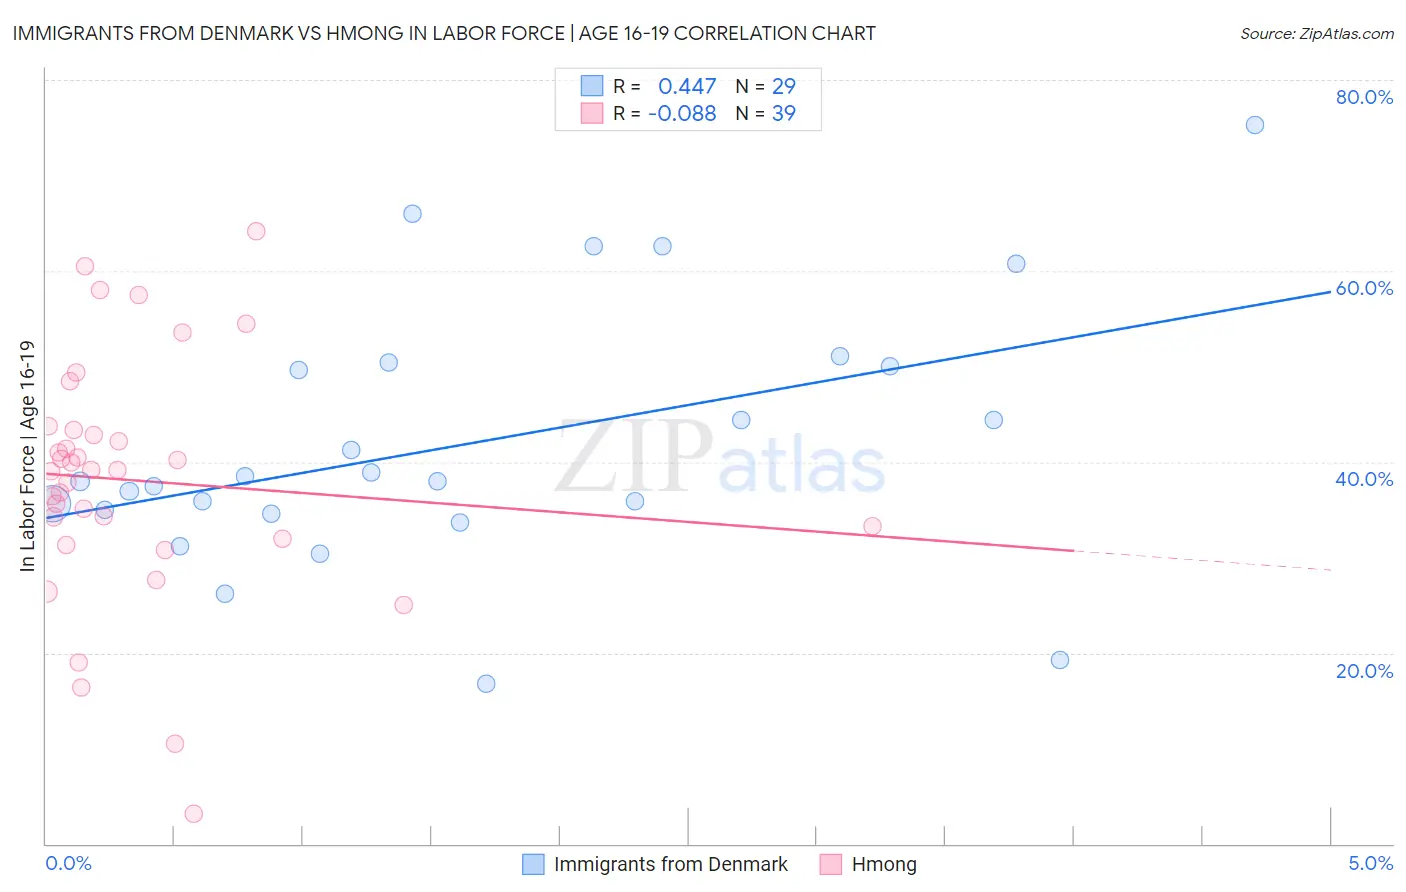
Immigrants from Denmark vs Hmong In Labor Force | Age 16-19 Correlation Chart
The statistical analysis conducted on geographies consisting of 136,287,705 people shows a moderate positive correlation between the proportion of Immigrants from Denmark and labor force participation rate among population between the ages 16 and 19 in the United States with a correlation coefficient (R) of 0.447 and weighted average of 36.1%. Similarly, the statistical analysis conducted on geographies consisting of 24,681,034 people shows a slight negative correlation between the proportion of Hmong and labor force participation rate among population between the ages 16 and 19 in the United States with a correlation coefficient (R) of -0.088 and weighted average of 38.7%, a difference of 7.4%.
In Labor Force | Age 16-19 Correlation Summary
| Measurement | Immigrants from Denmark | Hmong |
| Minimum | 16.7% | 3.1% |
| Maximum | 75.3% | 64.2% |
| Range | 58.6% | 61.1% |
| Mean | 42.1% | 38.1% |
| Median | 38.0% | 39.1% |
| Interquartile 25% (IQ1) | 34.8% | 31.9% |
| Interquartile 75% (IQ3) | 50.2% | 43.4% |
| Interquartile Range (IQR) | 15.4% | 11.5% |
| Standard Deviation (Sample) | 13.6% | 12.9% |
| Standard Deviation (Population) | 13.4% | 12.7% |
Similar Demographics by In Labor Force | Age 16-19
Demographics Similar to Immigrants from Denmark by In Labor Force | Age 16-19
In terms of in labor force | age 16-19, the demographic groups most similar to Immigrants from Denmark are Nigerian (36.1%, a difference of 0.030%), Afghan (36.1%, a difference of 0.040%), Bolivian (36.0%, a difference of 0.12%), Immigrants from Croatia (36.1%, a difference of 0.17%), and Panamanian (36.1%, a difference of 0.23%).
| Demographics | Rating | Rank | In Labor Force | Age 16-19 |
| Immigrants | Romania | 34.0 /100 | #186 | Fair 36.3% |
| Immigrants | Afghanistan | 34.0 /100 | #187 | Fair 36.3% |
| Immigrants | Europe | 31.8 /100 | #188 | Fair 36.2% |
| Immigrants | Hungary | 28.8 /100 | #189 | Fair 36.2% |
| Panamanians | 28.6 /100 | #190 | Fair 36.1% |
| Immigrants | Croatia | 27.5 /100 | #191 | Fair 36.1% |
| Afghans | 25.7 /100 | #192 | Fair 36.1% |
| Immigrants | Denmark | 25.0 /100 | #193 | Fair 36.1% |
| Nigerians | 24.6 /100 | #194 | Fair 36.1% |
| Bolivians | 23.3 /100 | #195 | Fair 36.0% |
| Mexican American Indians | 21.1 /100 | #196 | Fair 36.0% |
| Immigrants | Serbia | 21.0 /100 | #197 | Fair 36.0% |
| Immigrants | Northern Africa | 19.9 /100 | #198 | Poor 35.9% |
| Immigrants | Norway | 19.8 /100 | #199 | Poor 35.9% |
| Immigrants | Sweden | 18.8 /100 | #200 | Poor 35.9% |
Demographics Similar to Hmong by In Labor Force | Age 16-19
In terms of in labor force | age 16-19, the demographic groups most similar to Hmong are Zimbabwean (38.7%, a difference of 0.010%), Immigrants from Cameroon (38.7%, a difference of 0.040%), Immigrants from Thailand (38.7%, a difference of 0.070%), Immigrants from Eritrea (38.7%, a difference of 0.090%), and Iraqi (38.6%, a difference of 0.25%).
| Demographics | Rating | Rank | In Labor Force | Age 16-19 |
| Immigrants | Canada | 99.4 /100 | #94 | Exceptional 38.9% |
| Immigrants | North America | 99.4 /100 | #95 | Exceptional 38.9% |
| Latvians | 99.4 /100 | #96 | Exceptional 38.9% |
| Greeks | 99.3 /100 | #97 | Exceptional 38.9% |
| Ugandans | 99.3 /100 | #98 | Exceptional 38.9% |
| Immigrants | North Macedonia | 99.3 /100 | #99 | Exceptional 38.9% |
| Immigrants | Thailand | 99.1 /100 | #100 | Exceptional 38.7% |
| Hmong | 99.1 /100 | #101 | Exceptional 38.7% |
| Zimbabweans | 99.1 /100 | #102 | Exceptional 38.7% |
| Immigrants | Cameroon | 99.0 /100 | #103 | Exceptional 38.7% |
| Immigrants | Eritrea | 99.0 /100 | #104 | Exceptional 38.7% |
| Iraqis | 98.9 /100 | #105 | Exceptional 38.6% |
| Delaware | 98.8 /100 | #106 | Exceptional 38.6% |
| Chinese | 98.8 /100 | #107 | Exceptional 38.6% |
| Immigrants | Ethiopia | 98.7 /100 | #108 | Exceptional 38.6% |