Dutch vs Pakistani In Labor Force | Age > 16
COMPARE
Dutch
Pakistani
In Labor Force | Age > 16
In Labor Force | Age > 16 Comparison
Dutch
Pakistanis
64.2%
IN LABOR FORCE | AGE > 16
0.6/ 100
METRIC RATING
264th/ 347
METRIC RANK
65.8%
IN LABOR FORCE | AGE > 16
97.1/ 100
METRIC RATING
113th/ 347
METRIC RANK
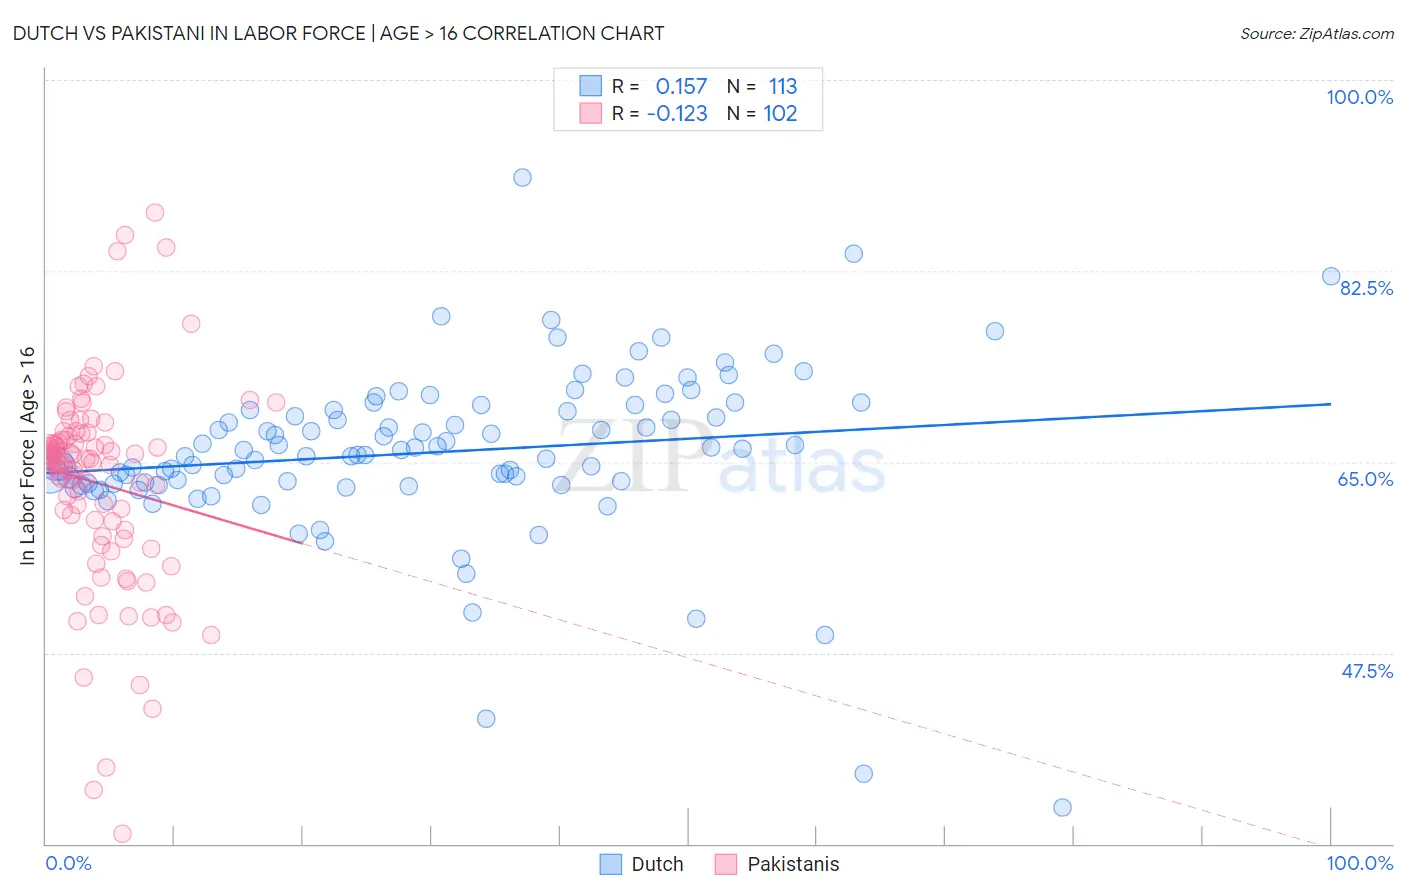
Dutch vs Pakistani In Labor Force | Age > 16 Correlation Chart
The statistical analysis conducted on geographies consisting of 554,365,938 people shows a poor positive correlation between the proportion of Dutch and labor force participation rate among population ages 16 and over in the United States with a correlation coefficient (R) of 0.157 and weighted average of 64.2%. Similarly, the statistical analysis conducted on geographies consisting of 335,364,967 people shows a poor negative correlation between the proportion of Pakistanis and labor force participation rate among population ages 16 and over in the United States with a correlation coefficient (R) of -0.123 and weighted average of 65.8%, a difference of 2.5%.
In Labor Force | Age > 16 Correlation Summary
| Measurement | Dutch | Pakistani |
| Minimum | 33.3% | 30.9% |
| Maximum | 91.1% | 87.8% |
| Range | 57.8% | 56.9% |
| Mean | 65.9% | 63.1% |
| Median | 65.6% | 65.1% |
| Interquartile 25% (IQ1) | 63.0% | 58.8% |
| Interquartile 75% (IQ3) | 69.8% | 67.3% |
| Interquartile Range (IQR) | 6.7% | 8.5% |
| Standard Deviation (Sample) | 7.8% | 9.5% |
| Standard Deviation (Population) | 7.8% | 9.5% |
Similar Demographics by In Labor Force | Age > 16
Demographics Similar to Dutch by In Labor Force | Age > 16
In terms of in labor force | age > 16, the demographic groups most similar to Dutch are Bahamian (64.2%, a difference of 0.020%), Finnish (64.2%, a difference of 0.030%), Cuban (64.2%, a difference of 0.040%), Immigrants from Western Europe (64.2%, a difference of 0.050%), and Marshallese (64.2%, a difference of 0.050%).
| Demographics | Rating | Rank | In Labor Force | Age > 16 |
| Inupiat | 0.8 /100 | #257 | Tragic 64.3% |
| Immigrants | Scotland | 0.8 /100 | #258 | Tragic 64.2% |
| Immigrants | Western Europe | 0.7 /100 | #259 | Tragic 64.2% |
| Marshallese | 0.7 /100 | #260 | Tragic 64.2% |
| Basques | 0.7 /100 | #261 | Tragic 64.2% |
| Finns | 0.7 /100 | #262 | Tragic 64.2% |
| Bahamians | 0.6 /100 | #263 | Tragic 64.2% |
| Dutch | 0.6 /100 | #264 | Tragic 64.2% |
| Cubans | 0.5 /100 | #265 | Tragic 64.2% |
| Immigrants | England | 0.5 /100 | #266 | Tragic 64.2% |
| Canadians | 0.5 /100 | #267 | Tragic 64.1% |
| Spaniards | 0.5 /100 | #268 | Tragic 64.1% |
| Irish | 0.4 /100 | #269 | Tragic 64.1% |
| Guyanese | 0.4 /100 | #270 | Tragic 64.1% |
| Dominicans | 0.4 /100 | #271 | Tragic 64.1% |
Demographics Similar to Pakistanis by In Labor Force | Age > 16
In terms of in labor force | age > 16, the demographic groups most similar to Pakistanis are Honduran (65.8%, a difference of 0.010%), Laotian (65.8%, a difference of 0.030%), Immigrants from Indonesia (65.7%, a difference of 0.030%), Immigrants from Honduras (65.8%, a difference of 0.040%), and Argentinean (65.7%, a difference of 0.040%).
| Demographics | Rating | Rank | In Labor Force | Age > 16 |
| Immigrants | Serbia | 98.1 /100 | #106 | Exceptional 65.8% |
| Immigrants | Poland | 98.1 /100 | #107 | Exceptional 65.8% |
| Immigrants | Spain | 98.0 /100 | #108 | Exceptional 65.8% |
| Immigrants | Japan | 98.0 /100 | #109 | Exceptional 65.8% |
| Japanese | 97.7 /100 | #110 | Exceptional 65.8% |
| Immigrants | Honduras | 97.5 /100 | #111 | Exceptional 65.8% |
| Laotians | 97.4 /100 | #112 | Exceptional 65.8% |
| Pakistanis | 97.1 /100 | #113 | Exceptional 65.8% |
| Hondurans | 97.1 /100 | #114 | Exceptional 65.8% |
| Immigrants | Indonesia | 96.8 /100 | #115 | Exceptional 65.7% |
| Argentineans | 96.7 /100 | #116 | Exceptional 65.7% |
| Immigrants | Iran | 96.6 /100 | #117 | Exceptional 65.7% |
| Immigrants | Thailand | 96.6 /100 | #118 | Exceptional 65.7% |
| Immigrants | France | 96.4 /100 | #119 | Exceptional 65.7% |
| Immigrants | Hong Kong | 96.2 /100 | #120 | Exceptional 65.7% |