Dutch vs Immigrants from Burma/Myanmar In Labor Force | Age > 16
COMPARE
Dutch
Immigrants from Burma/Myanmar
In Labor Force | Age > 16
In Labor Force | Age > 16 Comparison
Dutch
Immigrants from Burma/Myanmar
64.2%
IN LABOR FORCE | AGE > 16
0.6/ 100
METRIC RATING
264th/ 347
METRIC RANK
66.3%
IN LABOR FORCE | AGE > 16
99.8/ 100
METRIC RATING
61st/ 347
METRIC RANK
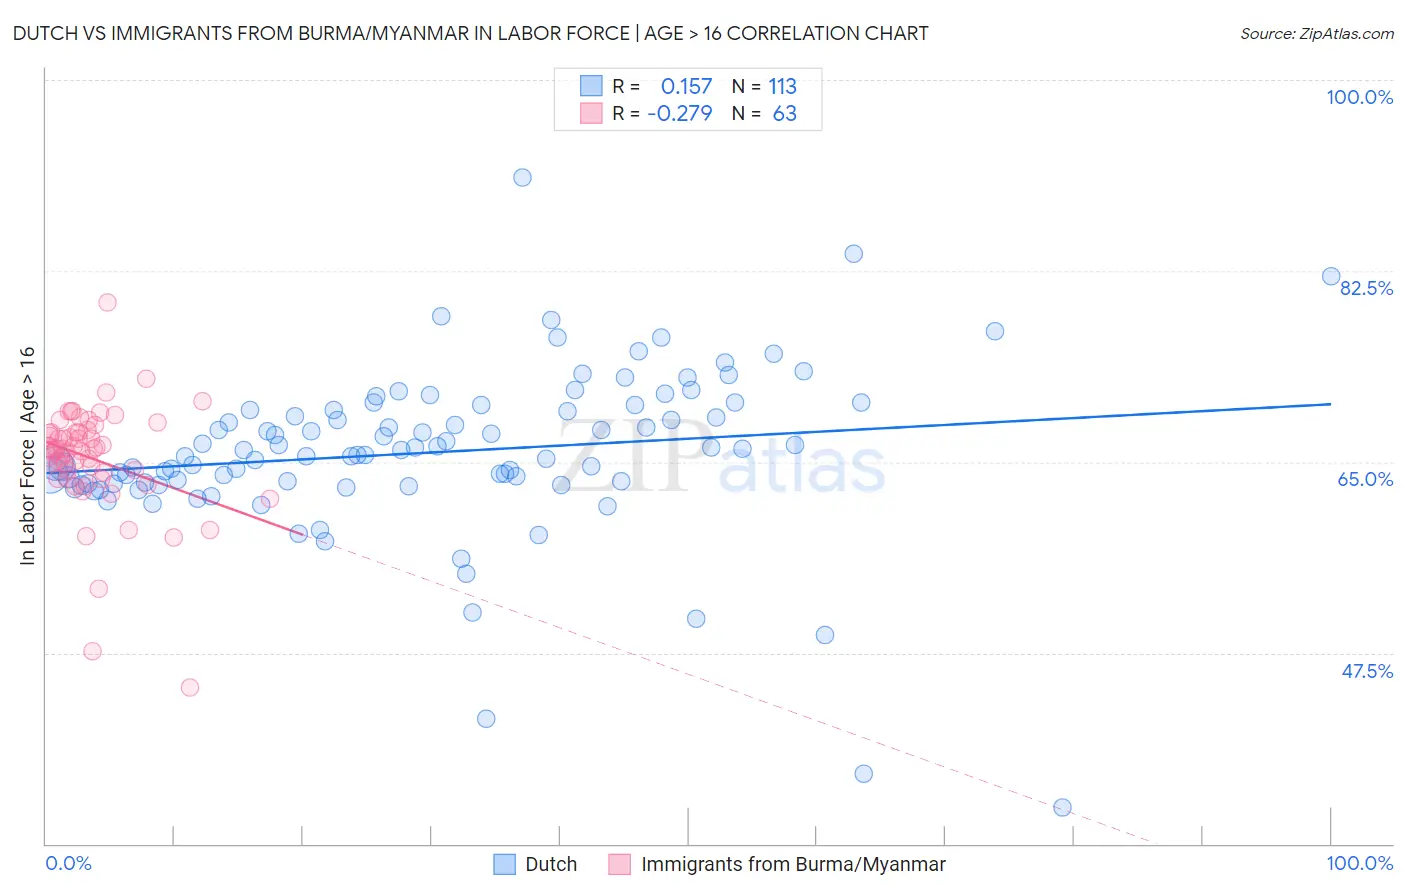
Dutch vs Immigrants from Burma/Myanmar In Labor Force | Age > 16 Correlation Chart
The statistical analysis conducted on geographies consisting of 554,365,938 people shows a poor positive correlation between the proportion of Dutch and labor force participation rate among population ages 16 and over in the United States with a correlation coefficient (R) of 0.157 and weighted average of 64.2%. Similarly, the statistical analysis conducted on geographies consisting of 172,361,065 people shows a weak negative correlation between the proportion of Immigrants from Burma/Myanmar and labor force participation rate among population ages 16 and over in the United States with a correlation coefficient (R) of -0.279 and weighted average of 66.3%, a difference of 3.3%.
In Labor Force | Age > 16 Correlation Summary
| Measurement | Dutch | Immigrants from Burma/Myanmar |
| Minimum | 33.3% | 44.3% |
| Maximum | 91.1% | 79.6% |
| Range | 57.8% | 35.3% |
| Mean | 65.9% | 65.3% |
| Median | 65.6% | 66.2% |
| Interquartile 25% (IQ1) | 63.0% | 63.5% |
| Interquartile 75% (IQ3) | 69.8% | 67.7% |
| Interquartile Range (IQR) | 6.7% | 4.2% |
| Standard Deviation (Sample) | 7.8% | 5.2% |
| Standard Deviation (Population) | 7.8% | 5.2% |
Similar Demographics by In Labor Force | Age > 16
Demographics Similar to Dutch by In Labor Force | Age > 16
In terms of in labor force | age > 16, the demographic groups most similar to Dutch are Bahamian (64.2%, a difference of 0.020%), Finnish (64.2%, a difference of 0.030%), Cuban (64.2%, a difference of 0.040%), Immigrants from Western Europe (64.2%, a difference of 0.050%), and Marshallese (64.2%, a difference of 0.050%).
| Demographics | Rating | Rank | In Labor Force | Age > 16 |
| Inupiat | 0.8 /100 | #257 | Tragic 64.3% |
| Immigrants | Scotland | 0.8 /100 | #258 | Tragic 64.2% |
| Immigrants | Western Europe | 0.7 /100 | #259 | Tragic 64.2% |
| Marshallese | 0.7 /100 | #260 | Tragic 64.2% |
| Basques | 0.7 /100 | #261 | Tragic 64.2% |
| Finns | 0.7 /100 | #262 | Tragic 64.2% |
| Bahamians | 0.6 /100 | #263 | Tragic 64.2% |
| Dutch | 0.6 /100 | #264 | Tragic 64.2% |
| Cubans | 0.5 /100 | #265 | Tragic 64.2% |
| Immigrants | England | 0.5 /100 | #266 | Tragic 64.2% |
| Canadians | 0.5 /100 | #267 | Tragic 64.1% |
| Spaniards | 0.5 /100 | #268 | Tragic 64.1% |
| Irish | 0.4 /100 | #269 | Tragic 64.1% |
| Guyanese | 0.4 /100 | #270 | Tragic 64.1% |
| Dominicans | 0.4 /100 | #271 | Tragic 64.1% |
Demographics Similar to Immigrants from Burma/Myanmar by In Labor Force | Age > 16
In terms of in labor force | age > 16, the demographic groups most similar to Immigrants from Burma/Myanmar are Immigrants from Peru (66.3%, a difference of 0.0%), Indonesian (66.3%, a difference of 0.0%), Immigrants from Turkey (66.3%, a difference of 0.030%), Venezuelan (66.3%, a difference of 0.040%), and Peruvian (66.3%, a difference of 0.040%).
| Demographics | Rating | Rank | In Labor Force | Age > 16 |
| Immigrants | Bosnia and Herzegovina | 99.9 /100 | #54 | Exceptional 66.5% |
| Immigrants | Venezuela | 99.9 /100 | #55 | Exceptional 66.4% |
| Immigrants | Senegal | 99.9 /100 | #56 | Exceptional 66.4% |
| Bulgarians | 99.9 /100 | #57 | Exceptional 66.4% |
| Immigrants | Saudi Arabia | 99.9 /100 | #58 | Exceptional 66.3% |
| Immigrants | Turkey | 99.9 /100 | #59 | Exceptional 66.3% |
| Immigrants | Peru | 99.8 /100 | #60 | Exceptional 66.3% |
| Immigrants | Burma/Myanmar | 99.8 /100 | #61 | Exceptional 66.3% |
| Indonesians | 99.8 /100 | #62 | Exceptional 66.3% |
| Venezuelans | 99.8 /100 | #63 | Exceptional 66.3% |
| Peruvians | 99.8 /100 | #64 | Exceptional 66.3% |
| Sri Lankans | 99.8 /100 | #65 | Exceptional 66.3% |
| Jordanians | 99.8 /100 | #66 | Exceptional 66.3% |
| Egyptians | 99.8 /100 | #67 | Exceptional 66.2% |
| Immigrants | Egypt | 99.7 /100 | #68 | Exceptional 66.2% |