Dutch vs Pakistani 5th Grade
COMPARE
Dutch
Pakistani
5th Grade
5th Grade Comparison
Dutch
Pakistanis
98.3%
5TH GRADE
100.0/ 100
METRIC RATING
14th/ 347
METRIC RANK
97.3%
5TH GRADE
40.2/ 100
METRIC RATING
180th/ 347
METRIC RANK
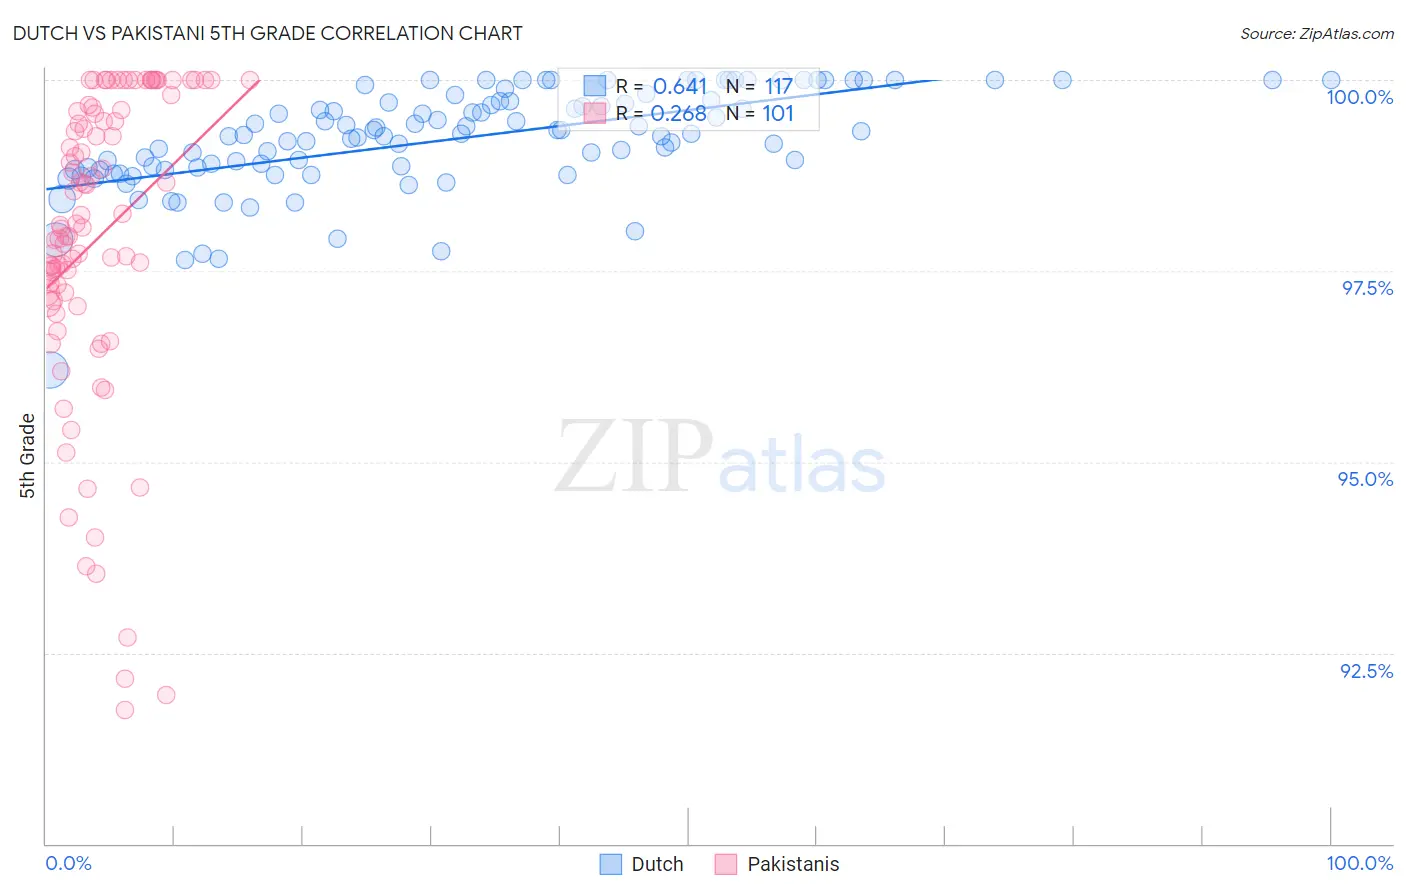
Dutch vs Pakistani 5th Grade Correlation Chart
The statistical analysis conducted on geographies consisting of 554,359,260 people shows a significant positive correlation between the proportion of Dutch and percentage of population with at least 5th grade education in the United States with a correlation coefficient (R) of 0.641 and weighted average of 98.3%. Similarly, the statistical analysis conducted on geographies consisting of 335,355,370 people shows a weak positive correlation between the proportion of Pakistanis and percentage of population with at least 5th grade education in the United States with a correlation coefficient (R) of 0.268 and weighted average of 97.3%, a difference of 1.0%.
5th Grade Correlation Summary
| Measurement | Dutch | Pakistani |
| Minimum | 96.2% | 91.8% |
| Maximum | 100.0% | 100.0% |
| Range | 3.8% | 8.2% |
| Mean | 99.2% | 97.9% |
| Median | 99.3% | 98.1% |
| Interquartile 25% (IQ1) | 98.8% | 97.2% |
| Interquartile 75% (IQ3) | 99.7% | 99.6% |
| Interquartile Range (IQR) | 0.90% | 2.5% |
| Standard Deviation (Sample) | 0.67% | 2.0% |
| Standard Deviation (Population) | 0.67% | 2.0% |
Similar Demographics by 5th Grade
Demographics Similar to Dutch by 5th Grade
In terms of 5th grade, the demographic groups most similar to Dutch are Tlingit-Haida (98.3%, a difference of 0.010%), Scottish (98.3%, a difference of 0.010%), Polish (98.3%, a difference of 0.010%), Carpatho Rusyn (98.3%, a difference of 0.020%), and Irish (98.3%, a difference of 0.020%).
| Demographics | Rating | Rank | 5th Grade |
| Inupiat | 100.0 /100 | #7 | Exceptional 98.4% |
| Slovenes | 100.0 /100 | #8 | Exceptional 98.3% |
| Swedes | 100.0 /100 | #9 | Exceptional 98.3% |
| English | 100.0 /100 | #10 | Exceptional 98.3% |
| Alaskan Athabascans | 100.0 /100 | #11 | Exceptional 98.3% |
| Carpatho Rusyns | 100.0 /100 | #12 | Exceptional 98.3% |
| Tlingit-Haida | 100.0 /100 | #13 | Exceptional 98.3% |
| Dutch | 100.0 /100 | #14 | Exceptional 98.3% |
| Scottish | 100.0 /100 | #15 | Exceptional 98.3% |
| Poles | 100.0 /100 | #16 | Exceptional 98.3% |
| Irish | 100.0 /100 | #17 | Exceptional 98.3% |
| Pennsylvania Germans | 100.0 /100 | #18 | Exceptional 98.3% |
| Finns | 100.0 /100 | #19 | Exceptional 98.2% |
| Lithuanians | 100.0 /100 | #20 | Exceptional 98.2% |
| Danes | 100.0 /100 | #21 | Exceptional 98.2% |
Demographics Similar to Pakistanis by 5th Grade
In terms of 5th grade, the demographic groups most similar to Pakistanis are Immigrants from Kenya (97.3%, a difference of 0.0%), Argentinean (97.3%, a difference of 0.0%), Mongolian (97.3%, a difference of 0.0%), Comanche (97.3%, a difference of 0.010%), and Immigrants from Ukraine (97.3%, a difference of 0.010%).
| Demographics | Rating | Rank | 5th Grade |
| Egyptians | 52.4 /100 | #173 | Average 97.3% |
| Immigrants | Kazakhstan | 50.0 /100 | #174 | Average 97.3% |
| Immigrants | Micronesia | 48.8 /100 | #175 | Average 97.3% |
| Immigrants | Taiwan | 48.4 /100 | #176 | Average 97.3% |
| Immigrants | Spain | 47.0 /100 | #177 | Average 97.3% |
| Comanche | 42.1 /100 | #178 | Average 97.3% |
| Immigrants | Kenya | 40.3 /100 | #179 | Average 97.3% |
| Pakistanis | 40.2 /100 | #180 | Average 97.3% |
| Argentineans | 39.5 /100 | #181 | Fair 97.3% |
| Mongolians | 39.4 /100 | #182 | Fair 97.3% |
| Immigrants | Ukraine | 38.6 /100 | #183 | Fair 97.3% |
| Immigrants | Venezuela | 38.4 /100 | #184 | Fair 97.3% |
| Dutch West Indians | 36.2 /100 | #185 | Fair 97.3% |
| Immigrants | Argentina | 36.1 /100 | #186 | Fair 97.3% |
| Spanish Americans | 34.7 /100 | #187 | Fair 97.3% |