Immigrants from West Indies vs Pakistani In Labor Force | Age > 16
COMPARE
Immigrants from West Indies
Pakistani
In Labor Force | Age > 16
In Labor Force | Age > 16 Comparison
Immigrants from West Indies
Pakistanis
65.6%
IN LABOR FORCE | AGE > 16
92.0/ 100
METRIC RATING
138th/ 347
METRIC RANK
65.8%
IN LABOR FORCE | AGE > 16
97.1/ 100
METRIC RATING
113th/ 347
METRIC RANK
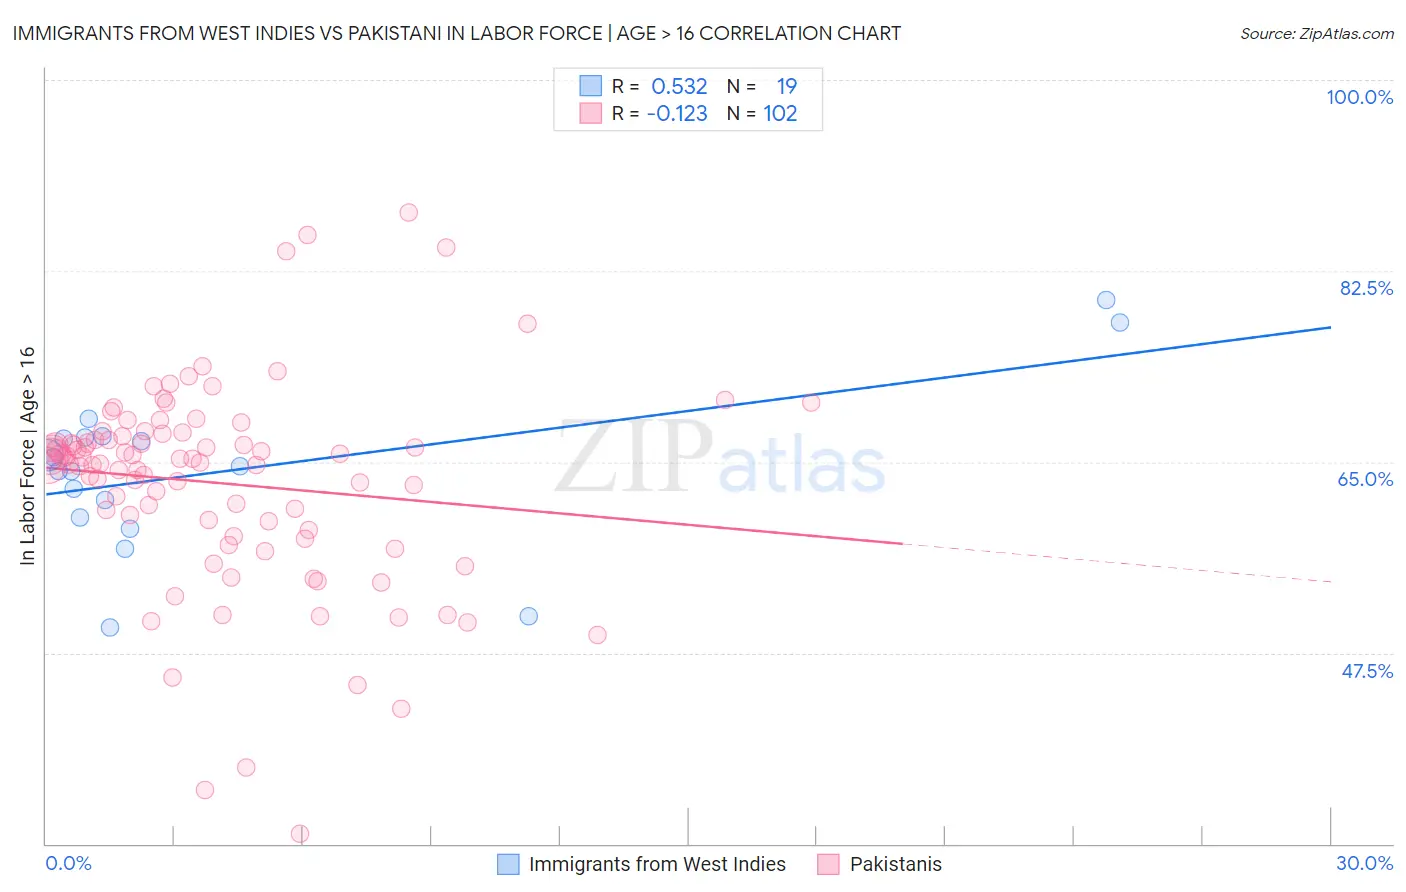
Immigrants from West Indies vs Pakistani In Labor Force | Age > 16 Correlation Chart
The statistical analysis conducted on geographies consisting of 72,456,461 people shows a substantial positive correlation between the proportion of Immigrants from West Indies and labor force participation rate among population ages 16 and over in the United States with a correlation coefficient (R) of 0.532 and weighted average of 65.6%. Similarly, the statistical analysis conducted on geographies consisting of 335,364,967 people shows a poor negative correlation between the proportion of Pakistanis and labor force participation rate among population ages 16 and over in the United States with a correlation coefficient (R) of -0.123 and weighted average of 65.8%, a difference of 0.30%.
In Labor Force | Age > 16 Correlation Summary
| Measurement | Immigrants from West Indies | Pakistani |
| Minimum | 49.8% | 30.9% |
| Maximum | 79.8% | 87.8% |
| Range | 30.0% | 56.9% |
| Mean | 64.2% | 63.1% |
| Median | 64.6% | 65.1% |
| Interquartile 25% (IQ1) | 60.0% | 58.8% |
| Interquartile 75% (IQ3) | 67.2% | 67.3% |
| Interquartile Range (IQR) | 7.2% | 8.5% |
| Standard Deviation (Sample) | 7.4% | 9.5% |
| Standard Deviation (Population) | 7.2% | 9.5% |
Similar Demographics by In Labor Force | Age > 16
Demographics Similar to Immigrants from West Indies by In Labor Force | Age > 16
In terms of in labor force | age > 16, the demographic groups most similar to Immigrants from West Indies are Guamanian/Chamorro (65.6%, a difference of 0.010%), Guatemalan (65.6%, a difference of 0.020%), Immigrants from Argentina (65.6%, a difference of 0.020%), Immigrants from Taiwan (65.5%, a difference of 0.040%), and Costa Rican (65.6%, a difference of 0.050%).
| Demographics | Rating | Rank | In Labor Force | Age > 16 |
| Icelanders | 94.3 /100 | #131 | Exceptional 65.6% |
| Immigrants | North Macedonia | 94.1 /100 | #132 | Exceptional 65.6% |
| Immigrants | Lithuania | 93.5 /100 | #133 | Exceptional 65.6% |
| Costa Ricans | 93.2 /100 | #134 | Exceptional 65.6% |
| Guatemalans | 92.5 /100 | #135 | Exceptional 65.6% |
| Immigrants | Argentina | 92.4 /100 | #136 | Exceptional 65.6% |
| Guamanians/Chamorros | 92.4 /100 | #137 | Exceptional 65.6% |
| Immigrants | West Indies | 92.0 /100 | #138 | Exceptional 65.6% |
| Immigrants | Taiwan | 90.8 /100 | #139 | Exceptional 65.5% |
| Immigrants | Costa Rica | 90.8 /100 | #140 | Exceptional 65.5% |
| Samoans | 90.5 /100 | #141 | Exceptional 65.5% |
| Indians (Asian) | 89.5 /100 | #142 | Excellent 65.5% |
| Latvians | 89.4 /100 | #143 | Excellent 65.5% |
| Immigrants | Romania | 88.6 /100 | #144 | Excellent 65.5% |
| Tlingit-Haida | 88.3 /100 | #145 | Excellent 65.5% |
Demographics Similar to Pakistanis by In Labor Force | Age > 16
In terms of in labor force | age > 16, the demographic groups most similar to Pakistanis are Honduran (65.8%, a difference of 0.010%), Laotian (65.8%, a difference of 0.030%), Immigrants from Indonesia (65.7%, a difference of 0.030%), Immigrants from Honduras (65.8%, a difference of 0.040%), and Argentinean (65.7%, a difference of 0.040%).
| Demographics | Rating | Rank | In Labor Force | Age > 16 |
| Immigrants | Serbia | 98.1 /100 | #106 | Exceptional 65.8% |
| Immigrants | Poland | 98.1 /100 | #107 | Exceptional 65.8% |
| Immigrants | Spain | 98.0 /100 | #108 | Exceptional 65.8% |
| Immigrants | Japan | 98.0 /100 | #109 | Exceptional 65.8% |
| Japanese | 97.7 /100 | #110 | Exceptional 65.8% |
| Immigrants | Honduras | 97.5 /100 | #111 | Exceptional 65.8% |
| Laotians | 97.4 /100 | #112 | Exceptional 65.8% |
| Pakistanis | 97.1 /100 | #113 | Exceptional 65.8% |
| Hondurans | 97.1 /100 | #114 | Exceptional 65.8% |
| Immigrants | Indonesia | 96.8 /100 | #115 | Exceptional 65.7% |
| Argentineans | 96.7 /100 | #116 | Exceptional 65.7% |
| Immigrants | Iran | 96.6 /100 | #117 | Exceptional 65.7% |
| Immigrants | Thailand | 96.6 /100 | #118 | Exceptional 65.7% |
| Immigrants | France | 96.4 /100 | #119 | Exceptional 65.7% |
| Immigrants | Hong Kong | 96.2 /100 | #120 | Exceptional 65.7% |