Colville vs Pakistani In Labor Force | Age > 16
COMPARE
Colville
Pakistani
In Labor Force | Age > 16
In Labor Force | Age > 16 Comparison
Colville
Pakistanis
59.8%
IN LABOR FORCE | AGE > 16
0.0/ 100
METRIC RATING
337th/ 347
METRIC RANK
65.8%
IN LABOR FORCE | AGE > 16
97.1/ 100
METRIC RATING
113th/ 347
METRIC RANK
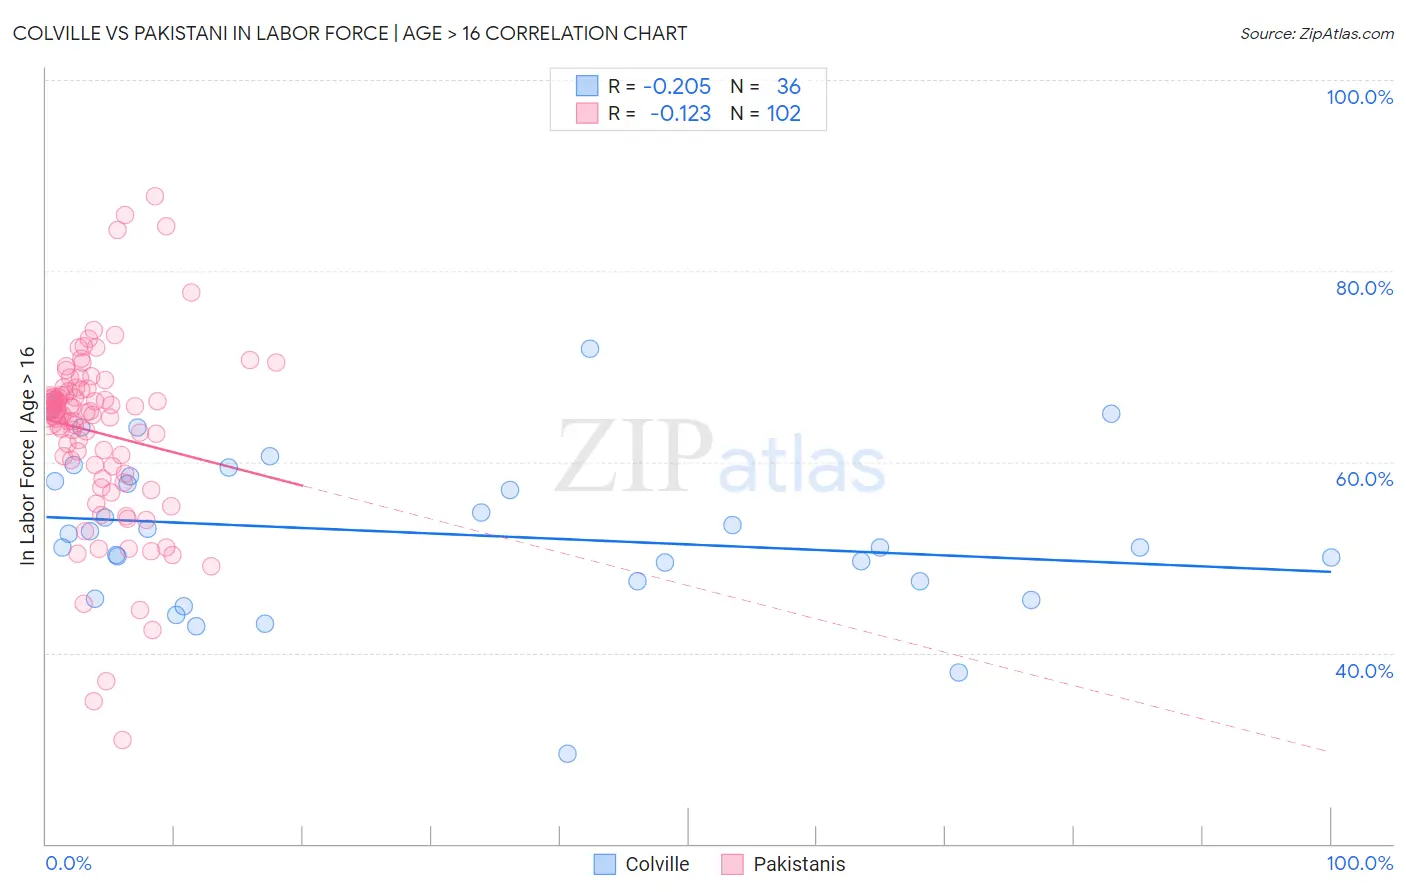
Colville vs Pakistani In Labor Force | Age > 16 Correlation Chart
The statistical analysis conducted on geographies consisting of 34,687,961 people shows a weak negative correlation between the proportion of Colville and labor force participation rate among population ages 16 and over in the United States with a correlation coefficient (R) of -0.205 and weighted average of 59.8%. Similarly, the statistical analysis conducted on geographies consisting of 335,364,967 people shows a poor negative correlation between the proportion of Pakistanis and labor force participation rate among population ages 16 and over in the United States with a correlation coefficient (R) of -0.123 and weighted average of 65.8%, a difference of 10.0%.
In Labor Force | Age > 16 Correlation Summary
| Measurement | Colville | Pakistani |
| Minimum | 29.4% | 30.9% |
| Maximum | 71.9% | 87.8% |
| Range | 42.5% | 56.9% |
| Mean | 52.5% | 63.1% |
| Median | 51.7% | 65.1% |
| Interquartile 25% (IQ1) | 47.5% | 58.8% |
| Interquartile 75% (IQ3) | 58.2% | 67.3% |
| Interquartile Range (IQR) | 10.7% | 8.5% |
| Standard Deviation (Sample) | 8.4% | 9.5% |
| Standard Deviation (Population) | 8.3% | 9.5% |
Similar Demographics by In Labor Force | Age > 16
Demographics Similar to Colville by In Labor Force | Age > 16
In terms of in labor force | age > 16, the demographic groups most similar to Colville are Immigrants from Yemen (59.6%, a difference of 0.27%), Houma (59.5%, a difference of 0.52%), Pueblo (59.3%, a difference of 0.92%), Menominee (60.6%, a difference of 1.3%), and Native/Alaskan (60.6%, a difference of 1.3%).
| Demographics | Rating | Rank | In Labor Force | Age > 16 |
| Creek | 0.0 /100 | #330 | Tragic 61.3% |
| Ute | 0.0 /100 | #331 | Tragic 60.9% |
| Crow | 0.0 /100 | #332 | Tragic 60.8% |
| Paiute | 0.0 /100 | #333 | Tragic 60.7% |
| Apache | 0.0 /100 | #334 | Tragic 60.7% |
| Natives/Alaskans | 0.0 /100 | #335 | Tragic 60.6% |
| Menominee | 0.0 /100 | #336 | Tragic 60.6% |
| Colville | 0.0 /100 | #337 | Tragic 59.8% |
| Immigrants | Yemen | 0.0 /100 | #338 | Tragic 59.6% |
| Houma | 0.0 /100 | #339 | Tragic 59.5% |
| Pueblo | 0.0 /100 | #340 | Tragic 59.3% |
| Hopi | 0.0 /100 | #341 | Tragic 58.4% |
| Puerto Ricans | 0.0 /100 | #342 | Tragic 58.1% |
| Yuman | 0.0 /100 | #343 | Tragic 57.8% |
| Pima | 0.0 /100 | #344 | Tragic 57.4% |
Demographics Similar to Pakistanis by In Labor Force | Age > 16
In terms of in labor force | age > 16, the demographic groups most similar to Pakistanis are Honduran (65.8%, a difference of 0.010%), Laotian (65.8%, a difference of 0.030%), Immigrants from Indonesia (65.7%, a difference of 0.030%), Immigrants from Honduras (65.8%, a difference of 0.040%), and Argentinean (65.7%, a difference of 0.040%).
| Demographics | Rating | Rank | In Labor Force | Age > 16 |
| Immigrants | Serbia | 98.1 /100 | #106 | Exceptional 65.8% |
| Immigrants | Poland | 98.1 /100 | #107 | Exceptional 65.8% |
| Immigrants | Spain | 98.0 /100 | #108 | Exceptional 65.8% |
| Immigrants | Japan | 98.0 /100 | #109 | Exceptional 65.8% |
| Japanese | 97.7 /100 | #110 | Exceptional 65.8% |
| Immigrants | Honduras | 97.5 /100 | #111 | Exceptional 65.8% |
| Laotians | 97.4 /100 | #112 | Exceptional 65.8% |
| Pakistanis | 97.1 /100 | #113 | Exceptional 65.8% |
| Hondurans | 97.1 /100 | #114 | Exceptional 65.8% |
| Immigrants | Indonesia | 96.8 /100 | #115 | Exceptional 65.7% |
| Argentineans | 96.7 /100 | #116 | Exceptional 65.7% |
| Immigrants | Iran | 96.6 /100 | #117 | Exceptional 65.7% |
| Immigrants | Thailand | 96.6 /100 | #118 | Exceptional 65.7% |
| Immigrants | France | 96.4 /100 | #119 | Exceptional 65.7% |
| Immigrants | Hong Kong | 96.2 /100 | #120 | Exceptional 65.7% |