Dutch vs Immigrants from Taiwan In Labor Force | Age > 16
COMPARE
Dutch
Immigrants from Taiwan
In Labor Force | Age > 16
In Labor Force | Age > 16 Comparison
Dutch
Immigrants from Taiwan
64.2%
IN LABOR FORCE | AGE > 16
0.6/ 100
METRIC RATING
264th/ 347
METRIC RANK
65.5%
IN LABOR FORCE | AGE > 16
90.8/ 100
METRIC RATING
139th/ 347
METRIC RANK
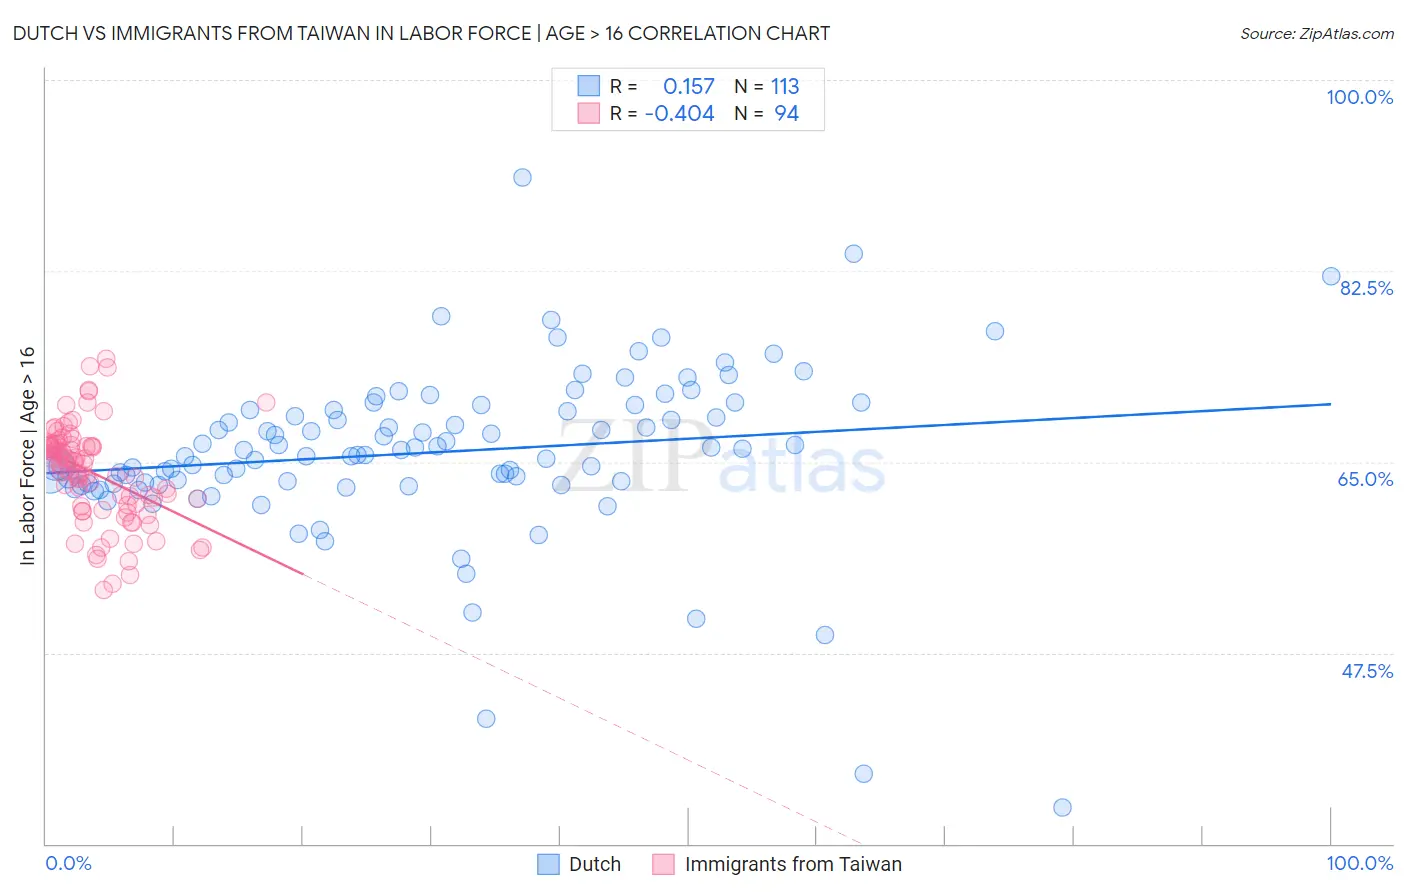
Dutch vs Immigrants from Taiwan In Labor Force | Age > 16 Correlation Chart
The statistical analysis conducted on geographies consisting of 554,365,938 people shows a poor positive correlation between the proportion of Dutch and labor force participation rate among population ages 16 and over in the United States with a correlation coefficient (R) of 0.157 and weighted average of 64.2%. Similarly, the statistical analysis conducted on geographies consisting of 298,260,285 people shows a moderate negative correlation between the proportion of Immigrants from Taiwan and labor force participation rate among population ages 16 and over in the United States with a correlation coefficient (R) of -0.404 and weighted average of 65.5%, a difference of 2.1%.
In Labor Force | Age > 16 Correlation Summary
| Measurement | Dutch | Immigrants from Taiwan |
| Minimum | 33.3% | 53.2% |
| Maximum | 91.1% | 74.4% |
| Range | 57.8% | 21.2% |
| Mean | 65.9% | 63.9% |
| Median | 65.6% | 64.8% |
| Interquartile 25% (IQ1) | 63.0% | 61.0% |
| Interquartile 75% (IQ3) | 69.8% | 66.6% |
| Interquartile Range (IQR) | 6.7% | 5.6% |
| Standard Deviation (Sample) | 7.8% | 4.5% |
| Standard Deviation (Population) | 7.8% | 4.4% |
Similar Demographics by In Labor Force | Age > 16
Demographics Similar to Dutch by In Labor Force | Age > 16
In terms of in labor force | age > 16, the demographic groups most similar to Dutch are Bahamian (64.2%, a difference of 0.020%), Finnish (64.2%, a difference of 0.030%), Cuban (64.2%, a difference of 0.040%), Immigrants from Western Europe (64.2%, a difference of 0.050%), and Marshallese (64.2%, a difference of 0.050%).
| Demographics | Rating | Rank | In Labor Force | Age > 16 |
| Inupiat | 0.8 /100 | #257 | Tragic 64.3% |
| Immigrants | Scotland | 0.8 /100 | #258 | Tragic 64.2% |
| Immigrants | Western Europe | 0.7 /100 | #259 | Tragic 64.2% |
| Marshallese | 0.7 /100 | #260 | Tragic 64.2% |
| Basques | 0.7 /100 | #261 | Tragic 64.2% |
| Finns | 0.7 /100 | #262 | Tragic 64.2% |
| Bahamians | 0.6 /100 | #263 | Tragic 64.2% |
| Dutch | 0.6 /100 | #264 | Tragic 64.2% |
| Cubans | 0.5 /100 | #265 | Tragic 64.2% |
| Immigrants | England | 0.5 /100 | #266 | Tragic 64.2% |
| Canadians | 0.5 /100 | #267 | Tragic 64.1% |
| Spaniards | 0.5 /100 | #268 | Tragic 64.1% |
| Irish | 0.4 /100 | #269 | Tragic 64.1% |
| Guyanese | 0.4 /100 | #270 | Tragic 64.1% |
| Dominicans | 0.4 /100 | #271 | Tragic 64.1% |
Demographics Similar to Immigrants from Taiwan by In Labor Force | Age > 16
In terms of in labor force | age > 16, the demographic groups most similar to Immigrants from Taiwan are Immigrants from Costa Rica (65.5%, a difference of 0.0%), Samoan (65.5%, a difference of 0.010%), Immigrants from West Indies (65.6%, a difference of 0.040%), Indian (Asian) (65.5%, a difference of 0.040%), and Latvian (65.5%, a difference of 0.040%).
| Demographics | Rating | Rank | In Labor Force | Age > 16 |
| Immigrants | North Macedonia | 94.1 /100 | #132 | Exceptional 65.6% |
| Immigrants | Lithuania | 93.5 /100 | #133 | Exceptional 65.6% |
| Costa Ricans | 93.2 /100 | #134 | Exceptional 65.6% |
| Guatemalans | 92.5 /100 | #135 | Exceptional 65.6% |
| Immigrants | Argentina | 92.4 /100 | #136 | Exceptional 65.6% |
| Guamanians/Chamorros | 92.4 /100 | #137 | Exceptional 65.6% |
| Immigrants | West Indies | 92.0 /100 | #138 | Exceptional 65.6% |
| Immigrants | Taiwan | 90.8 /100 | #139 | Exceptional 65.5% |
| Immigrants | Costa Rica | 90.8 /100 | #140 | Exceptional 65.5% |
| Samoans | 90.5 /100 | #141 | Exceptional 65.5% |
| Indians (Asian) | 89.5 /100 | #142 | Excellent 65.5% |
| Latvians | 89.4 /100 | #143 | Excellent 65.5% |
| Immigrants | Romania | 88.6 /100 | #144 | Excellent 65.5% |
| Tlingit-Haida | 88.3 /100 | #145 | Excellent 65.5% |
| Cypriots | 88.2 /100 | #146 | Excellent 65.5% |