Dutch vs Pakistani Per Capita Income
COMPARE
Dutch
Pakistani
Per Capita Income
Per Capita Income Comparison
Dutch
Pakistanis
$42,605
PER CAPITA INCOME
23.4/ 100
METRIC RATING
196th/ 347
METRIC RANK
$45,587
PER CAPITA INCOME
89.7/ 100
METRIC RATING
133rd/ 347
METRIC RANK
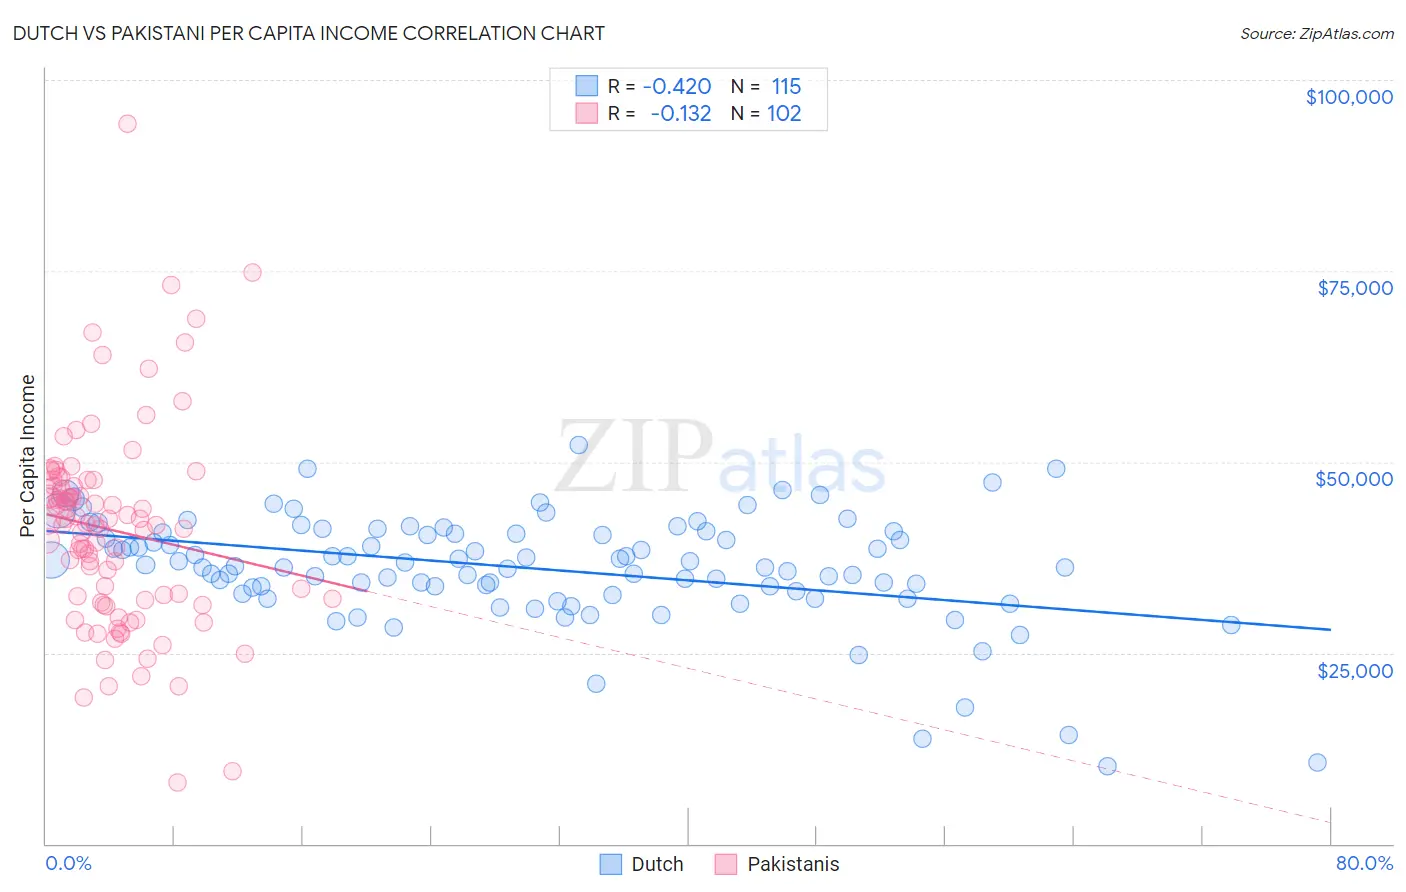
Dutch vs Pakistani Per Capita Income Correlation Chart
The statistical analysis conducted on geographies consisting of 554,404,949 people shows a moderate negative correlation between the proportion of Dutch and per capita income in the United States with a correlation coefficient (R) of -0.420 and weighted average of $42,605. Similarly, the statistical analysis conducted on geographies consisting of 335,371,609 people shows a poor negative correlation between the proportion of Pakistanis and per capita income in the United States with a correlation coefficient (R) of -0.132 and weighted average of $45,587, a difference of 7.0%.
Per Capita Income Correlation Summary
| Measurement | Dutch | Pakistani |
| Minimum | $10,108 | $8,026 |
| Maximum | $52,150 | $94,275 |
| Range | $42,042 | $86,249 |
| Mean | $36,061 | $41,080 |
| Median | $36,441 | $41,744 |
| Interquartile 25% (IQ1) | $33,045 | $31,965 |
| Interquartile 75% (IQ3) | $40,758 | $46,855 |
| Interquartile Range (IQR) | $7,713 | $14,890 |
| Standard Deviation (Sample) | $7,274 | $13,251 |
| Standard Deviation (Population) | $7,242 | $13,186 |
Similar Demographics by Per Capita Income
Demographics Similar to Dutch by Per Capita Income
In terms of per capita income, the demographic groups most similar to Dutch are Scotch-Irish ($42,563, a difference of 0.10%), Immigrants from Kenya ($42,661, a difference of 0.13%), Immigrants from Fiji ($42,694, a difference of 0.21%), Immigrants from Sierra Leone ($42,752, a difference of 0.34%), and Iraqi ($42,760, a difference of 0.36%).
| Demographics | Rating | Rank | Per Capita Income |
| Bermudans | 30.1 /100 | #189 | Fair $42,911 |
| Kenyans | 27.7 /100 | #190 | Fair $42,808 |
| Yugoslavians | 27.4 /100 | #191 | Fair $42,792 |
| Iraqis | 26.7 /100 | #192 | Fair $42,760 |
| Immigrants | Sierra Leone | 26.5 /100 | #193 | Fair $42,752 |
| Immigrants | Fiji | 25.2 /100 | #194 | Fair $42,694 |
| Immigrants | Kenya | 24.5 /100 | #195 | Fair $42,661 |
| Dutch | 23.4 /100 | #196 | Fair $42,605 |
| Scotch-Irish | 22.6 /100 | #197 | Fair $42,563 |
| Immigrants | Portugal | 19.7 /100 | #198 | Poor $42,412 |
| Barbadians | 19.6 /100 | #199 | Poor $42,406 |
| Vietnamese | 19.0 /100 | #200 | Poor $42,368 |
| Immigrants | Thailand | 17.6 /100 | #201 | Poor $42,289 |
| Immigrants | Bosnia and Herzegovina | 17.5 /100 | #202 | Poor $42,278 |
| Spanish | 17.0 /100 | #203 | Poor $42,249 |
Demographics Similar to Pakistanis by Per Capita Income
In terms of per capita income, the demographic groups most similar to Pakistanis are Slovene ($45,581, a difference of 0.010%), Jordanian ($45,605, a difference of 0.040%), Immigrants from North Macedonia ($45,622, a difference of 0.080%), Arab ($45,662, a difference of 0.16%), and Luxembourger ($45,663, a difference of 0.17%).
| Demographics | Rating | Rank | Per Capita Income |
| Palestinians | 91.6 /100 | #126 | Exceptional $45,790 |
| Immigrants | Germany | 91.3 /100 | #127 | Exceptional $45,751 |
| Swedes | 91.3 /100 | #128 | Exceptional $45,750 |
| Luxembourgers | 90.4 /100 | #129 | Exceptional $45,663 |
| Arabs | 90.4 /100 | #130 | Exceptional $45,662 |
| Immigrants | North Macedonia | 90.0 /100 | #131 | Exceptional $45,622 |
| Jordanians | 89.9 /100 | #132 | Excellent $45,605 |
| Pakistanis | 89.7 /100 | #133 | Excellent $45,587 |
| Slovenes | 89.6 /100 | #134 | Excellent $45,581 |
| Hungarians | 87.9 /100 | #135 | Excellent $45,426 |
| Immigrants | Oceania | 85.2 /100 | #136 | Excellent $45,220 |
| Immigrants | Syria | 85.2 /100 | #137 | Excellent $45,218 |
| Assyrians/Chaldeans/Syriacs | 84.8 /100 | #138 | Excellent $45,195 |
| Basques | 83.2 /100 | #139 | Excellent $45,086 |
| Immigrants | Jordan | 82.9 /100 | #140 | Excellent $45,066 |