Filipino vs Pakistani In Labor Force | Age > 16
COMPARE
Filipino
Pakistani
In Labor Force | Age > 16
In Labor Force | Age > 16 Comparison
Filipinos
Pakistanis
65.9%
IN LABOR FORCE | AGE > 16
98.9/ 100
METRIC RATING
97th/ 347
METRIC RANK
65.8%
IN LABOR FORCE | AGE > 16
97.1/ 100
METRIC RATING
113th/ 347
METRIC RANK
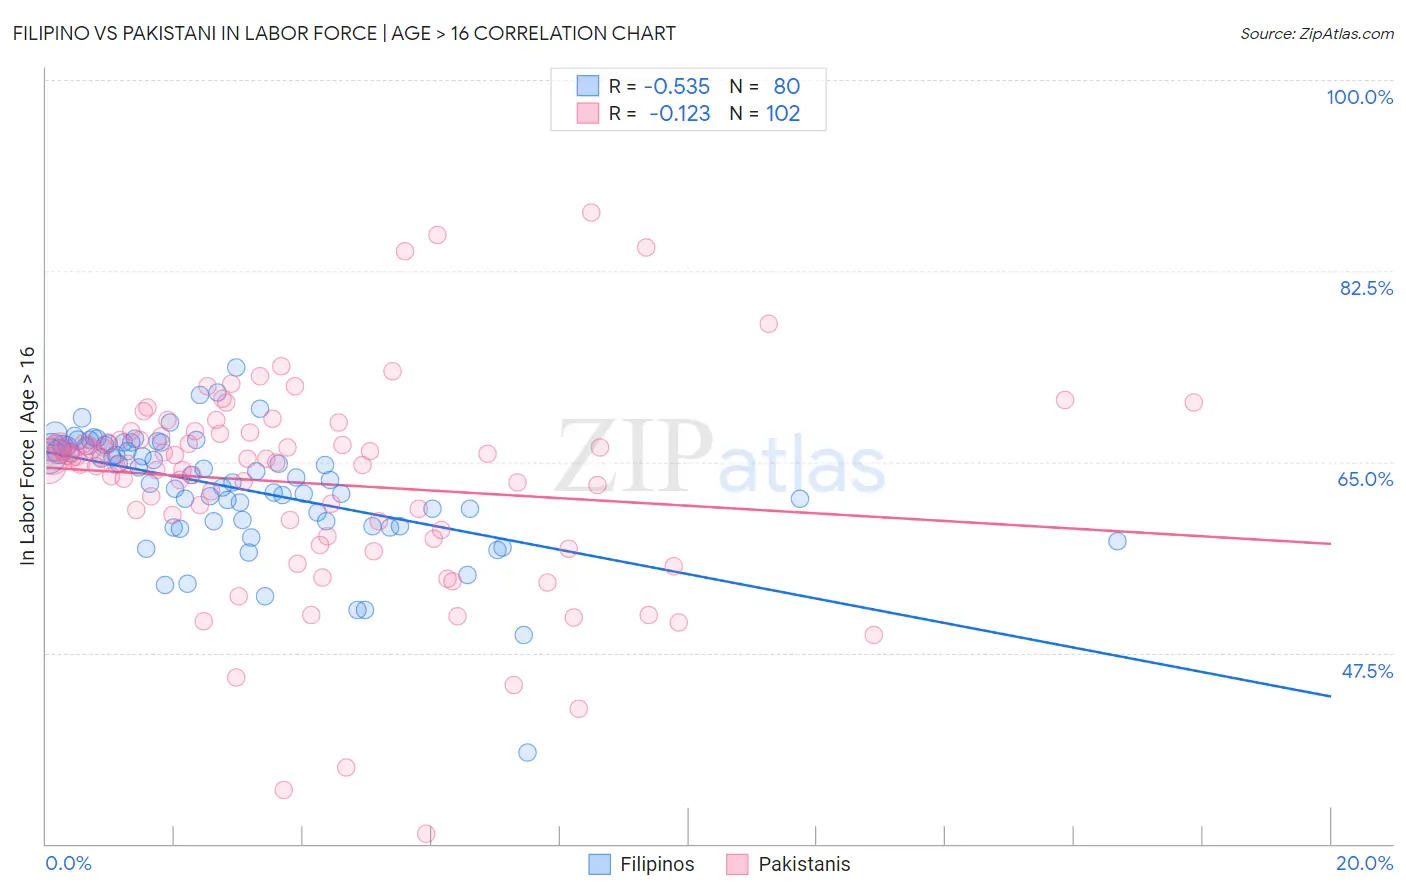
Filipino vs Pakistani In Labor Force | Age > 16 Correlation Chart
The statistical analysis conducted on geographies consisting of 254,350,604 people shows a substantial negative correlation between the proportion of Filipinos and labor force participation rate among population ages 16 and over in the United States with a correlation coefficient (R) of -0.535 and weighted average of 65.9%. Similarly, the statistical analysis conducted on geographies consisting of 335,364,967 people shows a poor negative correlation between the proportion of Pakistanis and labor force participation rate among population ages 16 and over in the United States with a correlation coefficient (R) of -0.123 and weighted average of 65.8%, a difference of 0.26%.
In Labor Force | Age > 16 Correlation Summary
| Measurement | Filipino | Pakistani |
| Minimum | 38.4% | 30.9% |
| Maximum | 73.7% | 87.8% |
| Range | 35.3% | 56.9% |
| Mean | 62.6% | 63.1% |
| Median | 63.7% | 65.1% |
| Interquartile 25% (IQ1) | 59.6% | 58.8% |
| Interquartile 75% (IQ3) | 66.6% | 67.3% |
| Interquartile Range (IQR) | 7.0% | 8.5% |
| Standard Deviation (Sample) | 5.6% | 9.5% |
| Standard Deviation (Population) | 5.5% | 9.5% |
Demographics Similar to Filipinos and Pakistanis by In Labor Force | Age > 16
In terms of in labor force | age > 16, the demographic groups most similar to Filipinos are Bangladeshi (65.9%, a difference of 0.010%), Immigrants from Chile (65.9%, a difference of 0.030%), Immigrants from Uruguay (66.0%, a difference of 0.050%), Immigrants from Australia (65.9%, a difference of 0.050%), and Okinawan (65.9%, a difference of 0.050%). Similarly, the demographic groups most similar to Pakistanis are Honduran (65.8%, a difference of 0.010%), Laotian (65.8%, a difference of 0.030%), Immigrants from Indonesia (65.7%, a difference of 0.030%), Immigrants from Honduras (65.8%, a difference of 0.040%), and Japanese (65.8%, a difference of 0.070%).
| Demographics | Rating | Rank | In Labor Force | Age > 16 |
| Immigrants | Uruguay | 99.1 /100 | #95 | Exceptional 66.0% |
| Bangladeshis | 98.9 /100 | #96 | Exceptional 65.9% |
| Filipinos | 98.9 /100 | #97 | Exceptional 65.9% |
| Immigrants | Chile | 98.7 /100 | #98 | Exceptional 65.9% |
| Immigrants | Australia | 98.7 /100 | #99 | Exceptional 65.9% |
| Okinawans | 98.7 /100 | #100 | Exceptional 65.9% |
| Immigrants | Colombia | 98.6 /100 | #101 | Exceptional 65.9% |
| Uruguayans | 98.6 /100 | #102 | Exceptional 65.9% |
| Immigrants | South Eastern Asia | 98.5 /100 | #103 | Exceptional 65.9% |
| Palestinians | 98.5 /100 | #104 | Exceptional 65.9% |
| Colombians | 98.4 /100 | #105 | Exceptional 65.9% |
| Immigrants | Serbia | 98.1 /100 | #106 | Exceptional 65.8% |
| Immigrants | Poland | 98.1 /100 | #107 | Exceptional 65.8% |
| Immigrants | Spain | 98.0 /100 | #108 | Exceptional 65.8% |
| Immigrants | Japan | 98.0 /100 | #109 | Exceptional 65.8% |
| Japanese | 97.7 /100 | #110 | Exceptional 65.8% |
| Immigrants | Honduras | 97.5 /100 | #111 | Exceptional 65.8% |
| Laotians | 97.4 /100 | #112 | Exceptional 65.8% |
| Pakistanis | 97.1 /100 | #113 | Exceptional 65.8% |
| Hondurans | 97.1 /100 | #114 | Exceptional 65.8% |
| Immigrants | Indonesia | 96.8 /100 | #115 | Exceptional 65.7% |