Crow vs Immigrants from Jamaica In Labor Force | Age 30-34
COMPARE
Crow
Immigrants from Jamaica
In Labor Force | Age 30-34
In Labor Force | Age 30-34 Comparison
Crow
Immigrants from Jamaica
75.9%
IN LABOR FORCE | AGE 30-34
0.0/ 100
METRIC RATING
346th/ 347
METRIC RANK
84.3%
IN LABOR FORCE | AGE 30-34
7.9/ 100
METRIC RATING
213th/ 347
METRIC RANK
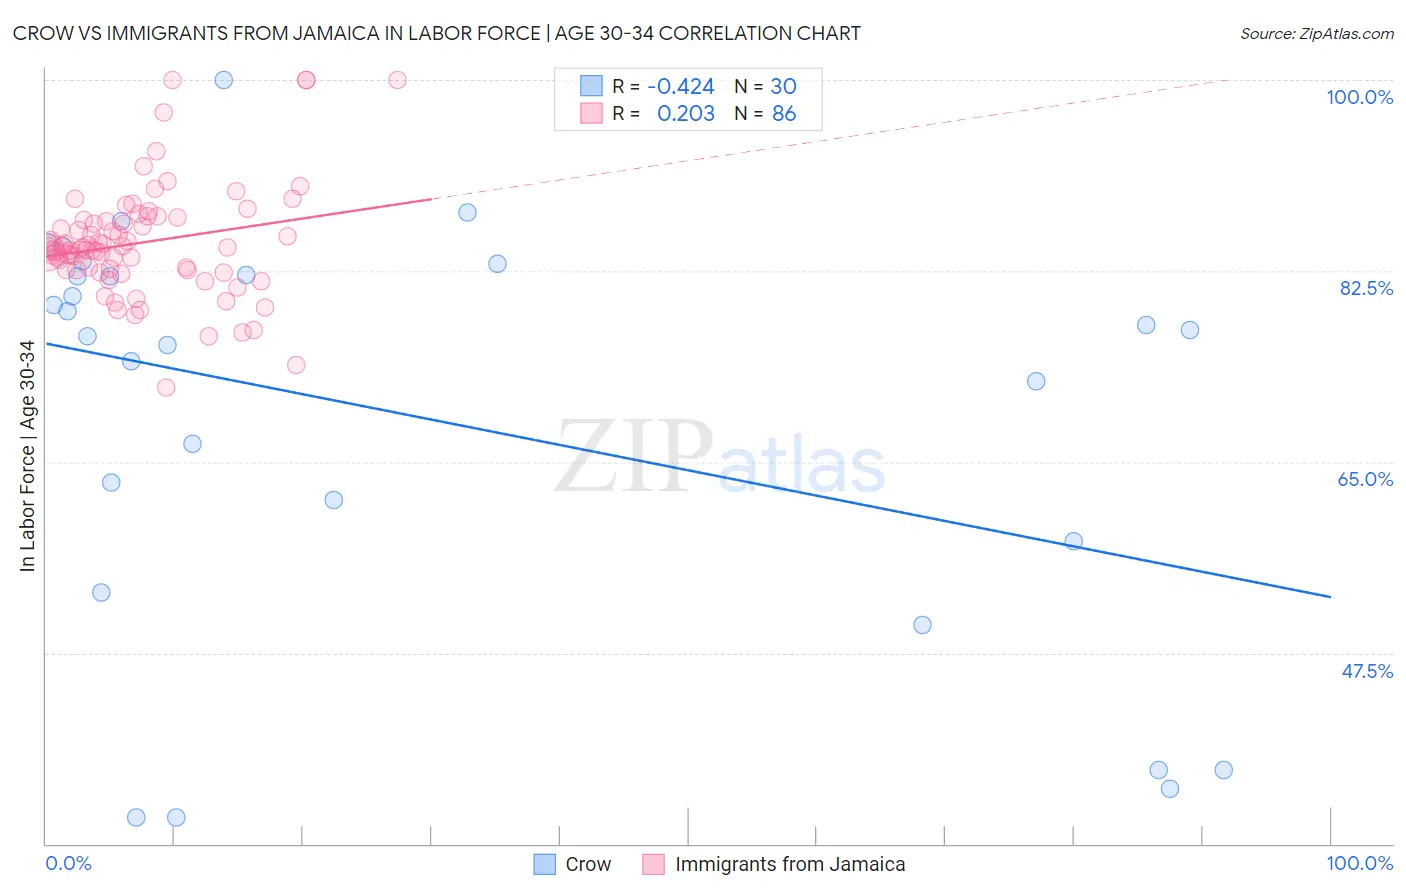
Crow vs Immigrants from Jamaica In Labor Force | Age 30-34 Correlation Chart
The statistical analysis conducted on geographies consisting of 59,195,148 people shows a moderate negative correlation between the proportion of Crow and labor force participation rate among population between the ages 30 and 34 in the United States with a correlation coefficient (R) of -0.424 and weighted average of 75.9%. Similarly, the statistical analysis conducted on geographies consisting of 301,677,479 people shows a weak positive correlation between the proportion of Immigrants from Jamaica and labor force participation rate among population between the ages 30 and 34 in the United States with a correlation coefficient (R) of 0.203 and weighted average of 84.3%, a difference of 11.1%.
In Labor Force | Age 30-34 Correlation Summary
| Measurement | Crow | Immigrants from Jamaica |
| Minimum | 32.4% | 71.8% |
| Maximum | 100.0% | 100.0% |
| Range | 67.6% | 28.2% |
| Mean | 69.1% | 85.1% |
| Median | 76.8% | 84.5% |
| Interquartile 25% (IQ1) | 57.7% | 82.6% |
| Interquartile 75% (IQ3) | 82.1% | 87.2% |
| Interquartile Range (IQR) | 24.4% | 4.6% |
| Standard Deviation (Sample) | 19.0% | 5.2% |
| Standard Deviation (Population) | 18.6% | 5.1% |
Similar Demographics by In Labor Force | Age 30-34
Demographics Similar to Crow by In Labor Force | Age 30-34
In terms of in labor force | age 30-34, the demographic groups most similar to Crow are Yup'ik (76.4%, a difference of 0.68%), Yuman (77.1%, a difference of 1.5%), Lumbee (77.3%, a difference of 1.8%), Tohono O'odham (77.7%, a difference of 2.4%), and Navajo (73.8%, a difference of 2.9%).
| Demographics | Rating | Rank | In Labor Force | Age 30-34 |
| Inupiat | 0.0 /100 | #333 | Tragic 79.7% |
| Hopi | 0.0 /100 | #334 | Tragic 79.3% |
| Marshallese | 0.0 /100 | #335 | Tragic 79.2% |
| Natives/Alaskans | 0.0 /100 | #336 | Tragic 79.2% |
| Yakama | 0.0 /100 | #337 | Tragic 79.1% |
| Pima | 0.0 /100 | #338 | Tragic 79.0% |
| Apache | 0.0 /100 | #339 | Tragic 79.0% |
| Ute | 0.0 /100 | #340 | Tragic 78.9% |
| Immigrants | Yemen | 0.0 /100 | #341 | Tragic 78.2% |
| Tohono O'odham | 0.0 /100 | #342 | Tragic 77.7% |
| Lumbee | 0.0 /100 | #343 | Tragic 77.3% |
| Yuman | 0.0 /100 | #344 | Tragic 77.1% |
| Yup'ik | 0.0 /100 | #345 | Tragic 76.4% |
| Crow | 0.0 /100 | #346 | Tragic 75.9% |
| Navajo | 0.0 /100 | #347 | Tragic 73.8% |
Demographics Similar to Immigrants from Jamaica by In Labor Force | Age 30-34
In terms of in labor force | age 30-34, the demographic groups most similar to Immigrants from Jamaica are Immigrants from Western Asia (84.3%, a difference of 0.010%), Arab (84.3%, a difference of 0.020%), Jamaican (84.3%, a difference of 0.020%), Indonesian (84.3%, a difference of 0.020%), and Japanese (84.3%, a difference of 0.020%).
| Demographics | Rating | Rank | In Labor Force | Age 30-34 |
| Lebanese | 10.6 /100 | #206 | Poor 84.4% |
| Bangladeshis | 9.4 /100 | #207 | Tragic 84.3% |
| Arabs | 8.9 /100 | #208 | Tragic 84.3% |
| Jamaicans | 8.8 /100 | #209 | Tragic 84.3% |
| Indonesians | 8.8 /100 | #210 | Tragic 84.3% |
| Japanese | 8.8 /100 | #211 | Tragic 84.3% |
| Immigrants | Western Asia | 8.2 /100 | #212 | Tragic 84.3% |
| Immigrants | Jamaica | 7.9 /100 | #213 | Tragic 84.3% |
| Immigrants | Germany | 7.2 /100 | #214 | Tragic 84.3% |
| Europeans | 7.2 /100 | #215 | Tragic 84.3% |
| Immigrants | Ecuador | 7.1 /100 | #216 | Tragic 84.3% |
| Immigrants | Trinidad and Tobago | 7.0 /100 | #217 | Tragic 84.3% |
| Immigrants | Panama | 6.3 /100 | #218 | Tragic 84.3% |
| Swiss | 5.8 /100 | #219 | Tragic 84.3% |
| Danes | 5.3 /100 | #220 | Tragic 84.3% |