Crow vs Immigrants from Albania In Labor Force | Age 30-34
COMPARE
Crow
Immigrants from Albania
In Labor Force | Age 30-34
In Labor Force | Age 30-34 Comparison
Crow
Immigrants from Albania
75.9%
IN LABOR FORCE | AGE 30-34
0.0/ 100
METRIC RATING
346th/ 347
METRIC RANK
86.1%
IN LABOR FORCE | AGE 30-34
100.0/ 100
METRIC RATING
15th/ 347
METRIC RANK
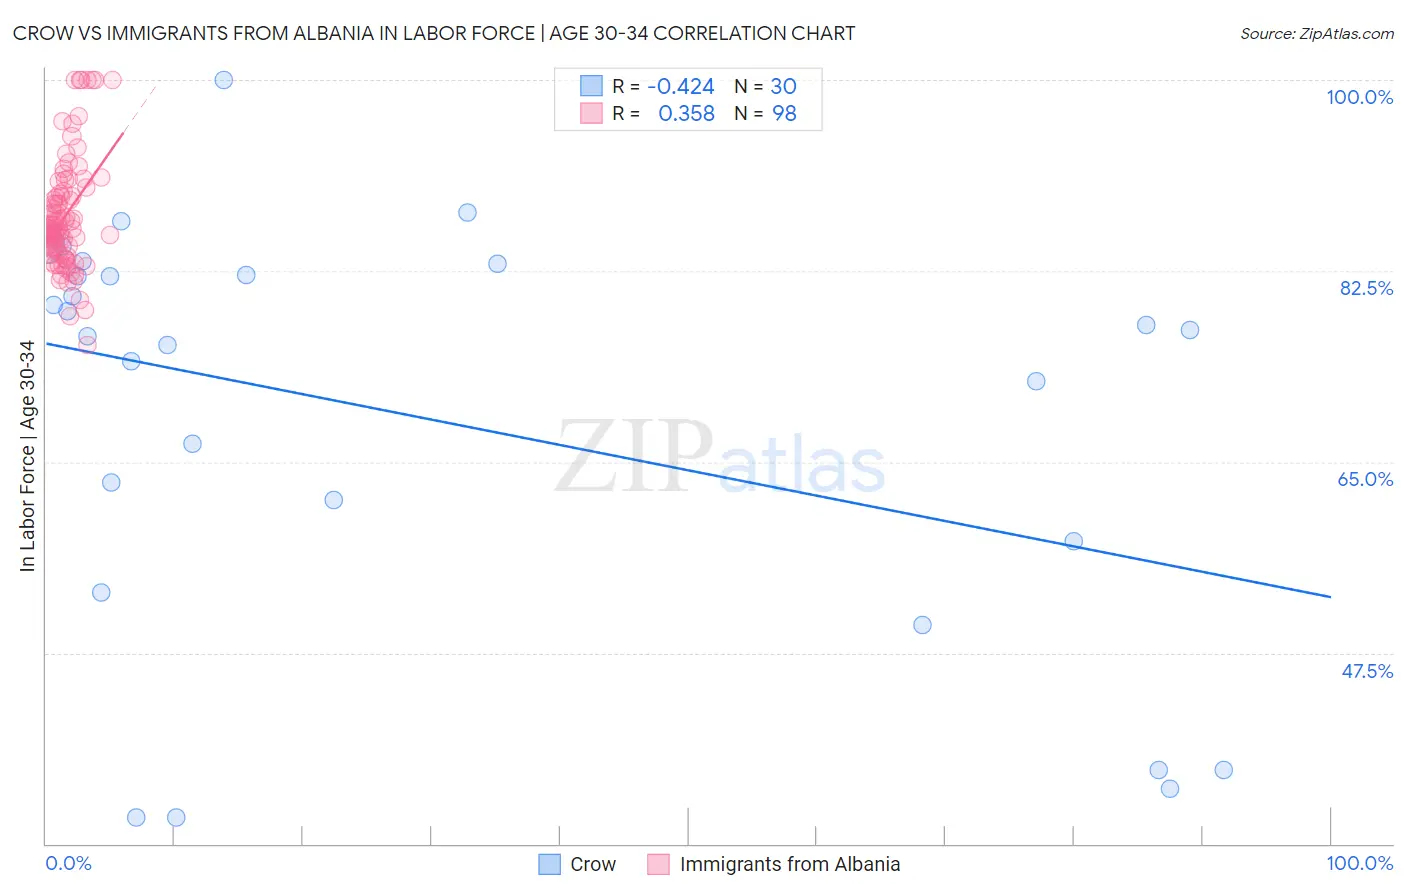
Crow vs Immigrants from Albania In Labor Force | Age 30-34 Correlation Chart
The statistical analysis conducted on geographies consisting of 59,195,148 people shows a moderate negative correlation between the proportion of Crow and labor force participation rate among population between the ages 30 and 34 in the United States with a correlation coefficient (R) of -0.424 and weighted average of 75.9%. Similarly, the statistical analysis conducted on geographies consisting of 119,375,013 people shows a mild positive correlation between the proportion of Immigrants from Albania and labor force participation rate among population between the ages 30 and 34 in the United States with a correlation coefficient (R) of 0.358 and weighted average of 86.1%, a difference of 13.4%.
In Labor Force | Age 30-34 Correlation Summary
| Measurement | Crow | Immigrants from Albania |
| Minimum | 32.4% | 75.7% |
| Maximum | 100.0% | 100.0% |
| Range | 67.6% | 24.3% |
| Mean | 69.1% | 87.5% |
| Median | 76.8% | 86.2% |
| Interquartile 25% (IQ1) | 57.7% | 84.3% |
| Interquartile 75% (IQ3) | 82.1% | 89.6% |
| Interquartile Range (IQR) | 24.4% | 5.3% |
| Standard Deviation (Sample) | 19.0% | 5.1% |
| Standard Deviation (Population) | 18.6% | 5.1% |
Similar Demographics by In Labor Force | Age 30-34
Demographics Similar to Crow by In Labor Force | Age 30-34
In terms of in labor force | age 30-34, the demographic groups most similar to Crow are Yup'ik (76.4%, a difference of 0.68%), Yuman (77.1%, a difference of 1.5%), Lumbee (77.3%, a difference of 1.8%), Tohono O'odham (77.7%, a difference of 2.4%), and Navajo (73.8%, a difference of 2.9%).
| Demographics | Rating | Rank | In Labor Force | Age 30-34 |
| Inupiat | 0.0 /100 | #333 | Tragic 79.7% |
| Hopi | 0.0 /100 | #334 | Tragic 79.3% |
| Marshallese | 0.0 /100 | #335 | Tragic 79.2% |
| Natives/Alaskans | 0.0 /100 | #336 | Tragic 79.2% |
| Yakama | 0.0 /100 | #337 | Tragic 79.1% |
| Pima | 0.0 /100 | #338 | Tragic 79.0% |
| Apache | 0.0 /100 | #339 | Tragic 79.0% |
| Ute | 0.0 /100 | #340 | Tragic 78.9% |
| Immigrants | Yemen | 0.0 /100 | #341 | Tragic 78.2% |
| Tohono O'odham | 0.0 /100 | #342 | Tragic 77.7% |
| Lumbee | 0.0 /100 | #343 | Tragic 77.3% |
| Yuman | 0.0 /100 | #344 | Tragic 77.1% |
| Yup'ik | 0.0 /100 | #345 | Tragic 76.4% |
| Crow | 0.0 /100 | #346 | Tragic 75.9% |
| Navajo | 0.0 /100 | #347 | Tragic 73.8% |
Demographics Similar to Immigrants from Albania by In Labor Force | Age 30-34
In terms of in labor force | age 30-34, the demographic groups most similar to Immigrants from Albania are Immigrants from Cabo Verde (86.1%, a difference of 0.010%), Bolivian (86.1%, a difference of 0.030%), Immigrants from Croatia (86.1%, a difference of 0.030%), Latvian (86.0%, a difference of 0.030%), and Immigrants from Cameroon (86.0%, a difference of 0.040%).
| Demographics | Rating | Rank | In Labor Force | Age 30-34 |
| Cambodians | 100.0 /100 | #8 | Exceptional 86.2% |
| Immigrants | Somalia | 100.0 /100 | #9 | Exceptional 86.2% |
| Immigrants | Serbia | 100.0 /100 | #10 | Exceptional 86.2% |
| Carpatho Rusyns | 100.0 /100 | #11 | Exceptional 86.2% |
| Bolivians | 100.0 /100 | #12 | Exceptional 86.1% |
| Immigrants | Croatia | 100.0 /100 | #13 | Exceptional 86.1% |
| Immigrants | Cabo Verde | 100.0 /100 | #14 | Exceptional 86.1% |
| Immigrants | Albania | 100.0 /100 | #15 | Exceptional 86.1% |
| Latvians | 100.0 /100 | #16 | Exceptional 86.0% |
| Immigrants | Cameroon | 100.0 /100 | #17 | Exceptional 86.0% |
| Immigrants | Sierra Leone | 100.0 /100 | #18 | Exceptional 86.0% |
| Sierra Leoneans | 100.0 /100 | #19 | Exceptional 86.0% |
| Bulgarians | 100.0 /100 | #20 | Exceptional 86.0% |
| Immigrants | Bulgaria | 100.0 /100 | #21 | Exceptional 86.0% |
| Bermudans | 100.0 /100 | #22 | Exceptional 85.9% |