Crow vs Ecuadorian In Labor Force | Age 30-34
COMPARE
Crow
Ecuadorian
In Labor Force | Age 30-34
In Labor Force | Age 30-34 Comparison
Crow
Ecuadorians
75.9%
IN LABOR FORCE | AGE 30-34
0.0/ 100
METRIC RATING
346th/ 347
METRIC RANK
84.4%
IN LABOR FORCE | AGE 30-34
14.2/ 100
METRIC RATING
204th/ 347
METRIC RANK
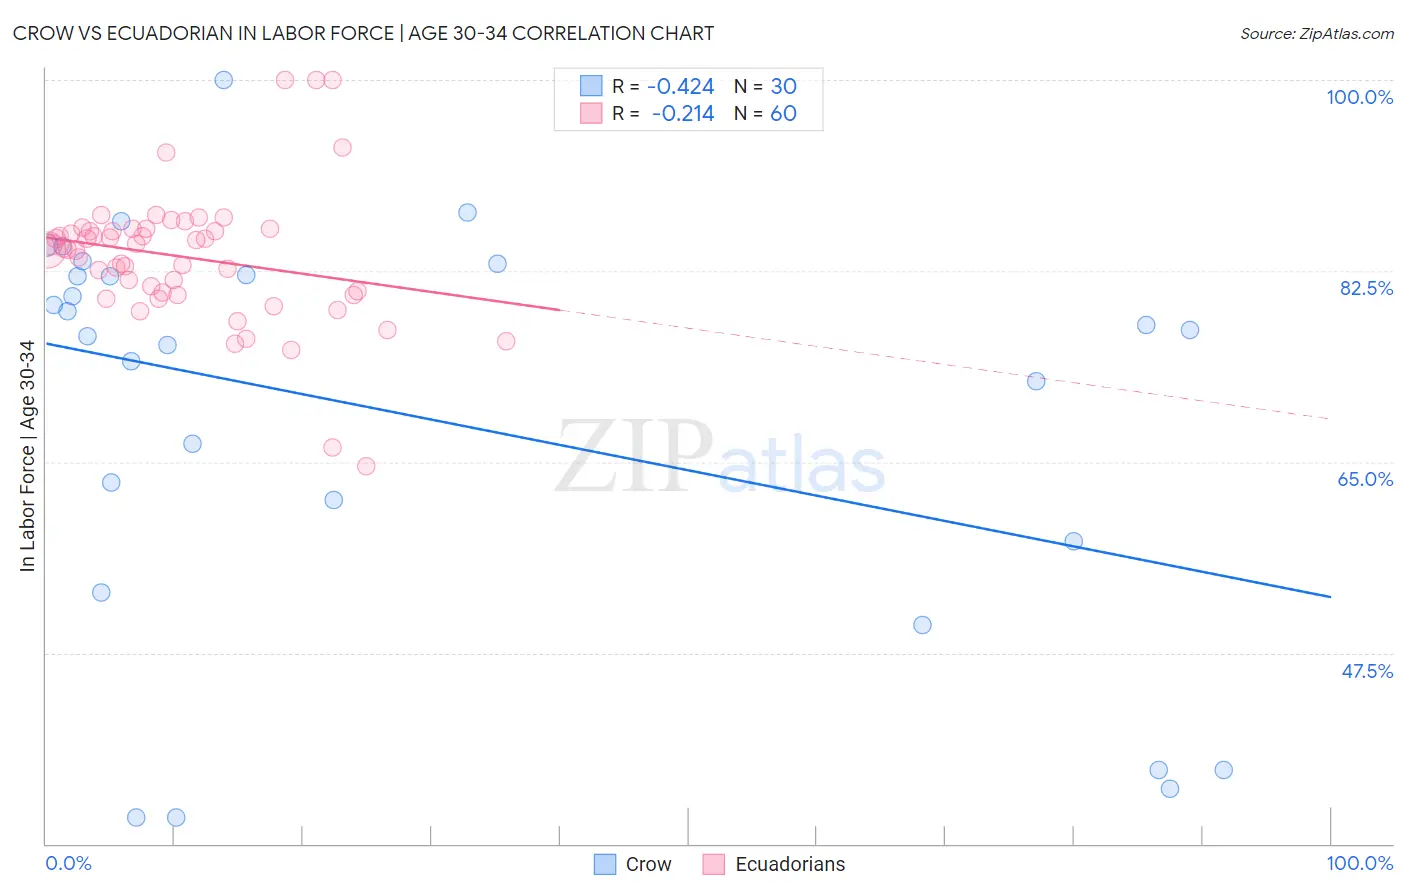
Crow vs Ecuadorian In Labor Force | Age 30-34 Correlation Chart
The statistical analysis conducted on geographies consisting of 59,195,148 people shows a moderate negative correlation between the proportion of Crow and labor force participation rate among population between the ages 30 and 34 in the United States with a correlation coefficient (R) of -0.424 and weighted average of 75.9%. Similarly, the statistical analysis conducted on geographies consisting of 317,665,283 people shows a weak negative correlation between the proportion of Ecuadorians and labor force participation rate among population between the ages 30 and 34 in the United States with a correlation coefficient (R) of -0.214 and weighted average of 84.4%, a difference of 11.2%.
In Labor Force | Age 30-34 Correlation Summary
| Measurement | Crow | Ecuadorian |
| Minimum | 32.4% | 64.6% |
| Maximum | 100.0% | 100.0% |
| Range | 67.6% | 35.4% |
| Mean | 69.1% | 83.8% |
| Median | 76.8% | 84.5% |
| Interquartile 25% (IQ1) | 57.7% | 80.4% |
| Interquartile 75% (IQ3) | 82.1% | 86.2% |
| Interquartile Range (IQR) | 24.4% | 5.8% |
| Standard Deviation (Sample) | 19.0% | 6.3% |
| Standard Deviation (Population) | 18.6% | 6.2% |
Similar Demographics by In Labor Force | Age 30-34
Demographics Similar to Crow by In Labor Force | Age 30-34
In terms of in labor force | age 30-34, the demographic groups most similar to Crow are Yup'ik (76.4%, a difference of 0.68%), Yuman (77.1%, a difference of 1.5%), Lumbee (77.3%, a difference of 1.8%), Tohono O'odham (77.7%, a difference of 2.4%), and Navajo (73.8%, a difference of 2.9%).
| Demographics | Rating | Rank | In Labor Force | Age 30-34 |
| Inupiat | 0.0 /100 | #333 | Tragic 79.7% |
| Hopi | 0.0 /100 | #334 | Tragic 79.3% |
| Marshallese | 0.0 /100 | #335 | Tragic 79.2% |
| Natives/Alaskans | 0.0 /100 | #336 | Tragic 79.2% |
| Yakama | 0.0 /100 | #337 | Tragic 79.1% |
| Pima | 0.0 /100 | #338 | Tragic 79.0% |
| Apache | 0.0 /100 | #339 | Tragic 79.0% |
| Ute | 0.0 /100 | #340 | Tragic 78.9% |
| Immigrants | Yemen | 0.0 /100 | #341 | Tragic 78.2% |
| Tohono O'odham | 0.0 /100 | #342 | Tragic 77.7% |
| Lumbee | 0.0 /100 | #343 | Tragic 77.3% |
| Yuman | 0.0 /100 | #344 | Tragic 77.1% |
| Yup'ik | 0.0 /100 | #345 | Tragic 76.4% |
| Crow | 0.0 /100 | #346 | Tragic 75.9% |
| Navajo | 0.0 /100 | #347 | Tragic 73.8% |
Demographics Similar to Ecuadorians by In Labor Force | Age 30-34
In terms of in labor force | age 30-34, the demographic groups most similar to Ecuadorians are French (84.4%, a difference of 0.010%), Canadian (84.4%, a difference of 0.020%), Trinidadian and Tobagonian (84.5%, a difference of 0.050%), Immigrants from West Indies (84.5%, a difference of 0.050%), and Immigrants from Thailand (84.5%, a difference of 0.060%).
| Demographics | Rating | Rank | In Labor Force | Age 30-34 |
| Immigrants | Syria | 21.9 /100 | #197 | Fair 84.5% |
| Dutch | 20.2 /100 | #198 | Fair 84.5% |
| Immigrants | Thailand | 19.1 /100 | #199 | Poor 84.5% |
| Sub-Saharan Africans | 19.0 /100 | #200 | Poor 84.5% |
| Trinidadians and Tobagonians | 18.2 /100 | #201 | Poor 84.5% |
| Immigrants | West Indies | 18.1 /100 | #202 | Poor 84.5% |
| Canadians | 15.4 /100 | #203 | Poor 84.4% |
| Ecuadorians | 14.2 /100 | #204 | Poor 84.4% |
| French | 13.8 /100 | #205 | Poor 84.4% |
| Lebanese | 10.6 /100 | #206 | Poor 84.4% |
| Bangladeshis | 9.4 /100 | #207 | Tragic 84.3% |
| Arabs | 8.9 /100 | #208 | Tragic 84.3% |
| Jamaicans | 8.8 /100 | #209 | Tragic 84.3% |
| Indonesians | 8.8 /100 | #210 | Tragic 84.3% |
| Japanese | 8.8 /100 | #211 | Tragic 84.3% |