Crow vs Immigrants from Jamaica In Labor Force | Age 45-54
COMPARE
Crow
Immigrants from Jamaica
In Labor Force | Age 45-54
In Labor Force | Age 45-54 Comparison
Crow
Immigrants from Jamaica
78.3%
IN LABOR FORCE | AGE 45-54
0.0/ 100
METRIC RATING
322nd/ 347
METRIC RANK
82.1%
IN LABOR FORCE | AGE 45-54
2.7/ 100
METRIC RATING
224th/ 347
METRIC RANK
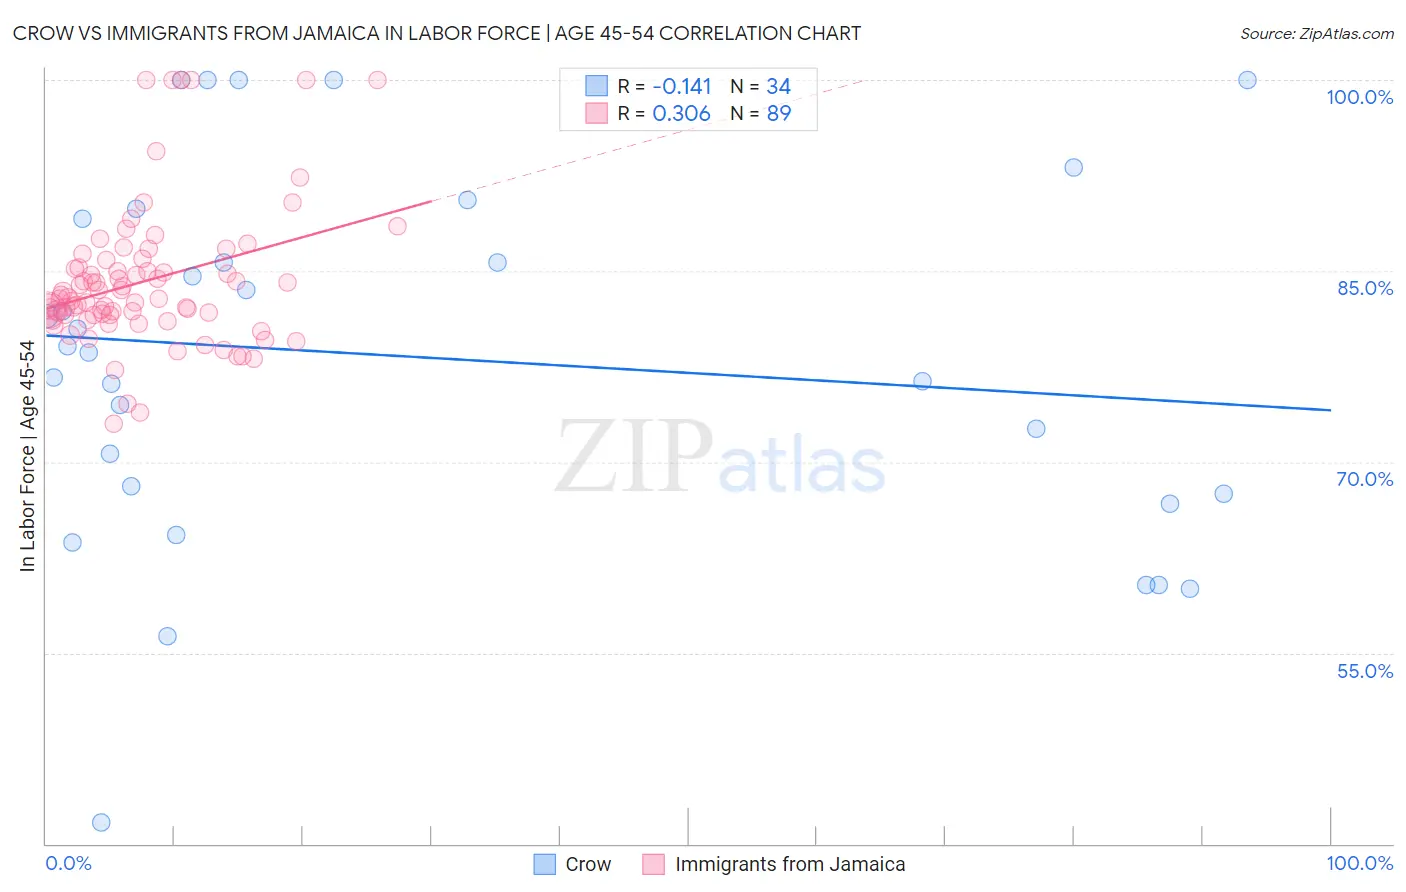
Crow vs Immigrants from Jamaica In Labor Force | Age 45-54 Correlation Chart
The statistical analysis conducted on geographies consisting of 59,202,110 people shows a poor negative correlation between the proportion of Crow and labor force participation rate among population between the ages 45 and 54 in the United States with a correlation coefficient (R) of -0.141 and weighted average of 78.3%. Similarly, the statistical analysis conducted on geographies consisting of 301,584,451 people shows a mild positive correlation between the proportion of Immigrants from Jamaica and labor force participation rate among population between the ages 45 and 54 in the United States with a correlation coefficient (R) of 0.306 and weighted average of 82.1%, a difference of 4.8%.
In Labor Force | Age 45-54 Correlation Summary
| Measurement | Crow | Immigrants from Jamaica |
| Minimum | 41.7% | 73.0% |
| Maximum | 100.0% | 100.0% |
| Range | 58.3% | 27.0% |
| Mean | 78.2% | 84.2% |
| Median | 78.8% | 82.8% |
| Interquartile 25% (IQ1) | 67.5% | 81.5% |
| Interquartile 75% (IQ3) | 89.1% | 85.5% |
| Interquartile Range (IQR) | 21.6% | 4.0% |
| Standard Deviation (Sample) | 14.4% | 5.6% |
| Standard Deviation (Population) | 14.2% | 5.5% |
Similar Demographics by In Labor Force | Age 45-54
Demographics Similar to Crow by In Labor Force | Age 45-54
In terms of in labor force | age 45-54, the demographic groups most similar to Crow are Kiowa (78.3%, a difference of 0.080%), Dutch West Indian (78.2%, a difference of 0.10%), Choctaw (78.2%, a difference of 0.20%), Seminole (78.1%, a difference of 0.24%), and Cajun (78.1%, a difference of 0.25%).
| Demographics | Rating | Rank | In Labor Force | Age 45-54 |
| Blacks/African Americans | 0.0 /100 | #315 | Tragic 79.3% |
| Shoshone | 0.0 /100 | #316 | Tragic 79.3% |
| Comanche | 0.0 /100 | #317 | Tragic 79.2% |
| Chickasaw | 0.0 /100 | #318 | Tragic 79.0% |
| Cherokee | 0.0 /100 | #319 | Tragic 79.0% |
| Yaqui | 0.0 /100 | #320 | Tragic 78.9% |
| Yup'ik | 0.0 /100 | #321 | Tragic 78.6% |
| Crow | 0.0 /100 | #322 | Tragic 78.3% |
| Kiowa | 0.0 /100 | #323 | Tragic 78.3% |
| Dutch West Indians | 0.0 /100 | #324 | Tragic 78.2% |
| Choctaw | 0.0 /100 | #325 | Tragic 78.2% |
| Seminole | 0.0 /100 | #326 | Tragic 78.1% |
| Cajuns | 0.0 /100 | #327 | Tragic 78.1% |
| Sioux | 0.0 /100 | #328 | Tragic 78.0% |
| Creek | 0.0 /100 | #329 | Tragic 77.7% |
Demographics Similar to Immigrants from Jamaica by In Labor Force | Age 45-54
In terms of in labor force | age 45-54, the demographic groups most similar to Immigrants from Jamaica are Immigrants from Oceania (82.1%, a difference of 0.020%), Immigrants from Caribbean (82.1%, a difference of 0.020%), Immigrants (82.1%, a difference of 0.030%), Immigrants from Germany (82.1%, a difference of 0.030%), and Panamanian (82.2%, a difference of 0.060%).
| Demographics | Rating | Rank | In Labor Force | Age 45-54 |
| Portuguese | 4.7 /100 | #217 | Tragic 82.2% |
| English | 4.4 /100 | #218 | Tragic 82.2% |
| French | 4.1 /100 | #219 | Tragic 82.2% |
| Bahamians | 3.6 /100 | #220 | Tragic 82.2% |
| Panamanians | 3.5 /100 | #221 | Tragic 82.2% |
| Immigrants | Ecuador | 3.4 /100 | #222 | Tragic 82.2% |
| Immigrants | Immigrants | 3.1 /100 | #223 | Tragic 82.1% |
| Immigrants | Jamaica | 2.7 /100 | #224 | Tragic 82.1% |
| Immigrants | Oceania | 2.5 /100 | #225 | Tragic 82.1% |
| Immigrants | Caribbean | 2.5 /100 | #226 | Tragic 82.1% |
| Immigrants | Germany | 2.4 /100 | #227 | Tragic 82.1% |
| Cape Verdeans | 2.1 /100 | #228 | Tragic 82.1% |
| Immigrants | Burma/Myanmar | 1.9 /100 | #229 | Tragic 82.0% |
| Jamaicans | 1.8 /100 | #230 | Tragic 82.0% |
| Immigrants | Senegal | 1.7 /100 | #231 | Tragic 82.0% |