Immigrants from Belarus vs Immigrants from Jamaica In Labor Force | Age 30-34
COMPARE
Immigrants from Belarus
Immigrants from Jamaica
In Labor Force | Age 30-34
In Labor Force | Age 30-34 Comparison
Immigrants from Belarus
Immigrants from Jamaica
85.2%
IN LABOR FORCE | AGE 30-34
96.9/ 100
METRIC RATING
101st/ 347
METRIC RANK
84.3%
IN LABOR FORCE | AGE 30-34
7.9/ 100
METRIC RATING
213th/ 347
METRIC RANK
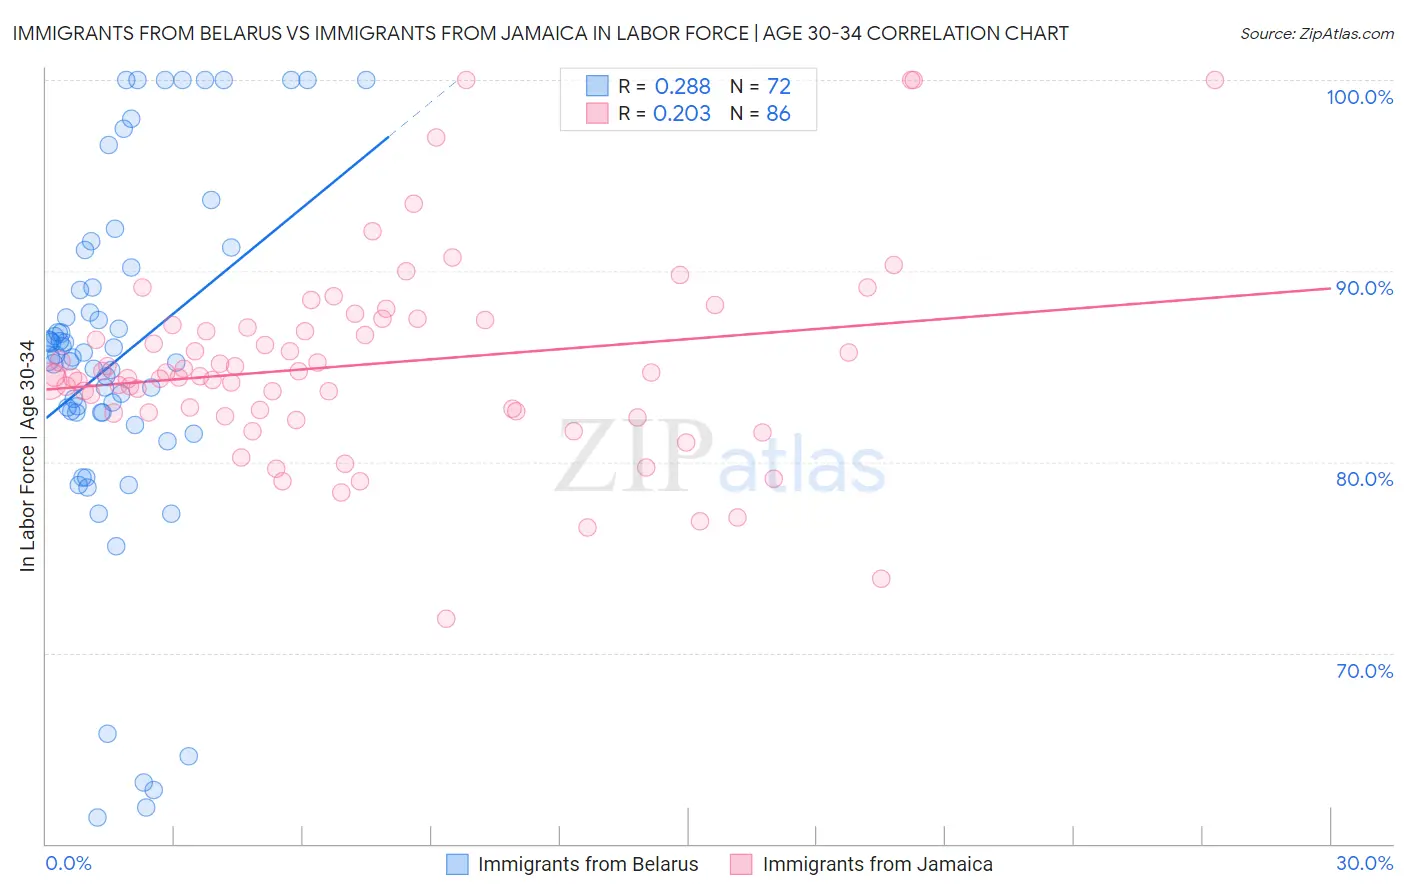
Immigrants from Belarus vs Immigrants from Jamaica In Labor Force | Age 30-34 Correlation Chart
The statistical analysis conducted on geographies consisting of 150,197,798 people shows a weak positive correlation between the proportion of Immigrants from Belarus and labor force participation rate among population between the ages 30 and 34 in the United States with a correlation coefficient (R) of 0.288 and weighted average of 85.2%. Similarly, the statistical analysis conducted on geographies consisting of 301,677,479 people shows a weak positive correlation between the proportion of Immigrants from Jamaica and labor force participation rate among population between the ages 30 and 34 in the United States with a correlation coefficient (R) of 0.203 and weighted average of 84.3%, a difference of 1.0%.
In Labor Force | Age 30-34 Correlation Summary
| Measurement | Immigrants from Belarus | Immigrants from Jamaica |
| Minimum | 61.4% | 71.8% |
| Maximum | 100.0% | 100.0% |
| Range | 38.6% | 28.2% |
| Mean | 85.4% | 85.1% |
| Median | 85.5% | 84.5% |
| Interquartile 25% (IQ1) | 82.6% | 82.6% |
| Interquartile 75% (IQ3) | 89.7% | 87.2% |
| Interquartile Range (IQR) | 7.1% | 4.6% |
| Standard Deviation (Sample) | 9.3% | 5.2% |
| Standard Deviation (Population) | 9.2% | 5.1% |
Similar Demographics by In Labor Force | Age 30-34
Demographics Similar to Immigrants from Belarus by In Labor Force | Age 30-34
In terms of in labor force | age 30-34, the demographic groups most similar to Immigrants from Belarus are Belgian (85.2%, a difference of 0.010%), Sudanese (85.2%, a difference of 0.010%), Immigrants from Austria (85.2%, a difference of 0.010%), Immigrants from Korea (85.2%, a difference of 0.020%), and Thai (85.2%, a difference of 0.020%).
| Demographics | Rating | Rank | In Labor Force | Age 30-34 |
| Swedes | 97.5 /100 | #94 | Exceptional 85.2% |
| Immigrants | India | 97.4 /100 | #95 | Exceptional 85.2% |
| Immigrants | Korea | 97.3 /100 | #96 | Exceptional 85.2% |
| Thais | 97.2 /100 | #97 | Exceptional 85.2% |
| Immigrants | Uganda | 97.2 /100 | #98 | Exceptional 85.2% |
| Belgians | 97.2 /100 | #99 | Exceptional 85.2% |
| Sudanese | 97.1 /100 | #100 | Exceptional 85.2% |
| Immigrants | Belarus | 96.9 /100 | #101 | Exceptional 85.2% |
| Immigrants | Austria | 96.8 /100 | #102 | Exceptional 85.2% |
| Ukrainians | 96.6 /100 | #103 | Exceptional 85.2% |
| Immigrants | Ghana | 96.5 /100 | #104 | Exceptional 85.2% |
| Alsatians | 96.3 /100 | #105 | Exceptional 85.2% |
| Immigrants | Middle Africa | 96.3 /100 | #106 | Exceptional 85.2% |
| Immigrants | Northern Africa | 96.3 /100 | #107 | Exceptional 85.2% |
| Immigrants | Zimbabwe | 95.8 /100 | #108 | Exceptional 85.1% |
Demographics Similar to Immigrants from Jamaica by In Labor Force | Age 30-34
In terms of in labor force | age 30-34, the demographic groups most similar to Immigrants from Jamaica are Immigrants from Western Asia (84.3%, a difference of 0.010%), Arab (84.3%, a difference of 0.020%), Jamaican (84.3%, a difference of 0.020%), Indonesian (84.3%, a difference of 0.020%), and Japanese (84.3%, a difference of 0.020%).
| Demographics | Rating | Rank | In Labor Force | Age 30-34 |
| Lebanese | 10.6 /100 | #206 | Poor 84.4% |
| Bangladeshis | 9.4 /100 | #207 | Tragic 84.3% |
| Arabs | 8.9 /100 | #208 | Tragic 84.3% |
| Jamaicans | 8.8 /100 | #209 | Tragic 84.3% |
| Indonesians | 8.8 /100 | #210 | Tragic 84.3% |
| Japanese | 8.8 /100 | #211 | Tragic 84.3% |
| Immigrants | Western Asia | 8.2 /100 | #212 | Tragic 84.3% |
| Immigrants | Jamaica | 7.9 /100 | #213 | Tragic 84.3% |
| Immigrants | Germany | 7.2 /100 | #214 | Tragic 84.3% |
| Europeans | 7.2 /100 | #215 | Tragic 84.3% |
| Immigrants | Ecuador | 7.1 /100 | #216 | Tragic 84.3% |
| Immigrants | Trinidad and Tobago | 7.0 /100 | #217 | Tragic 84.3% |
| Immigrants | Panama | 6.3 /100 | #218 | Tragic 84.3% |
| Swiss | 5.8 /100 | #219 | Tragic 84.3% |
| Danes | 5.3 /100 | #220 | Tragic 84.3% |