Polish vs Immigrants from Jamaica In Labor Force | Age 30-34
COMPARE
Polish
Immigrants from Jamaica
In Labor Force | Age 30-34
In Labor Force | Age 30-34 Comparison
Poles
Immigrants from Jamaica
85.5%
IN LABOR FORCE | AGE 30-34
99.6/ 100
METRIC RATING
58th/ 347
METRIC RANK
84.3%
IN LABOR FORCE | AGE 30-34
7.9/ 100
METRIC RATING
213th/ 347
METRIC RANK
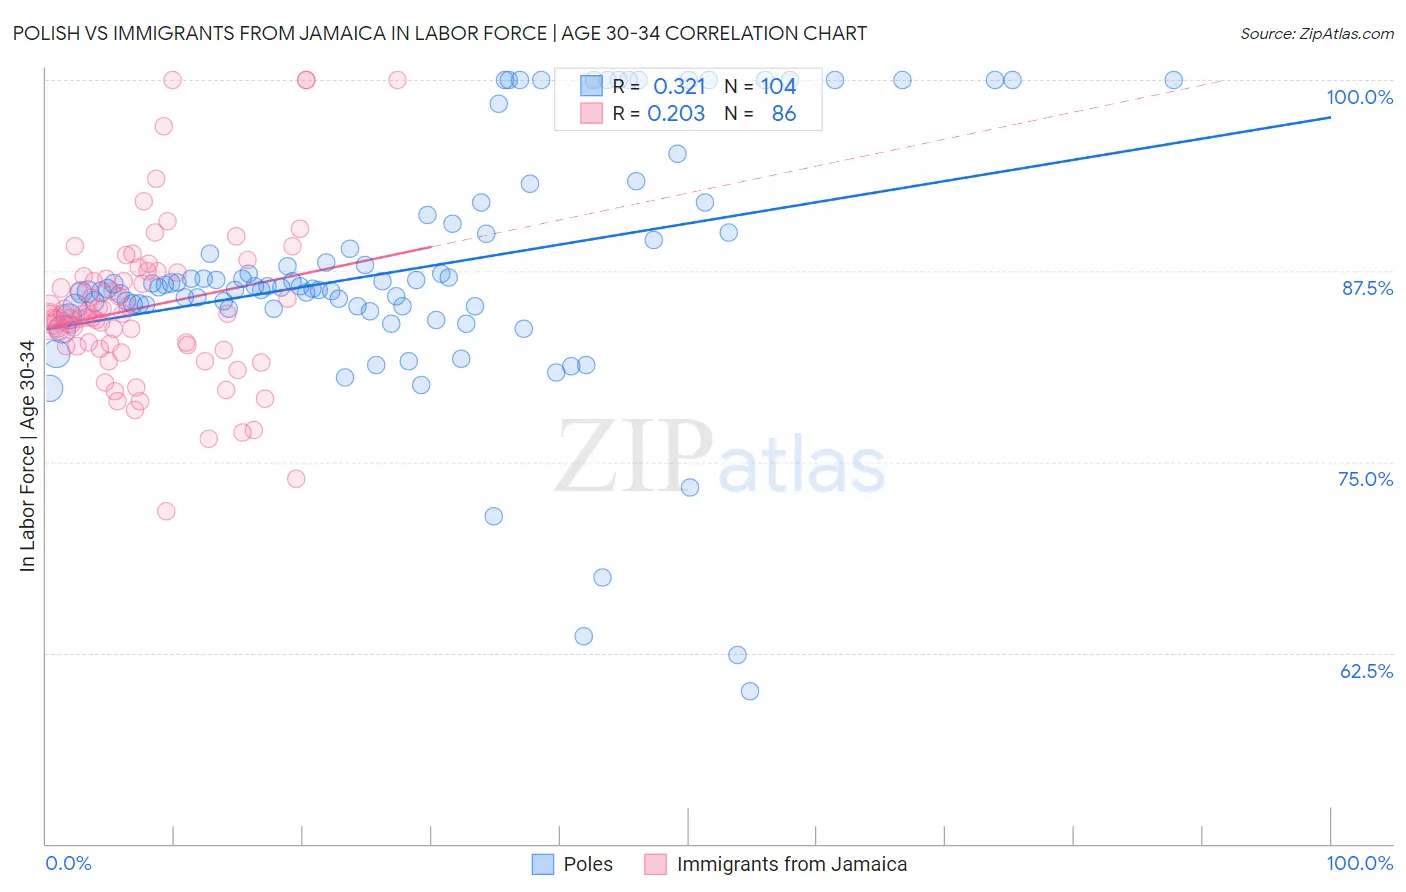
Polish vs Immigrants from Jamaica In Labor Force | Age 30-34 Correlation Chart
The statistical analysis conducted on geographies consisting of 559,395,237 people shows a mild positive correlation between the proportion of Poles and labor force participation rate among population between the ages 30 and 34 in the United States with a correlation coefficient (R) of 0.321 and weighted average of 85.5%. Similarly, the statistical analysis conducted on geographies consisting of 301,677,479 people shows a weak positive correlation between the proportion of Immigrants from Jamaica and labor force participation rate among population between the ages 30 and 34 in the United States with a correlation coefficient (R) of 0.203 and weighted average of 84.3%, a difference of 1.4%.
In Labor Force | Age 30-34 Correlation Summary
| Measurement | Polish | Immigrants from Jamaica |
| Minimum | 60.0% | 71.8% |
| Maximum | 100.0% | 100.0% |
| Range | 40.0% | 28.2% |
| Mean | 87.5% | 85.1% |
| Median | 86.5% | 84.5% |
| Interquartile 25% (IQ1) | 85.2% | 82.6% |
| Interquartile 75% (IQ3) | 90.3% | 87.2% |
| Interquartile Range (IQR) | 5.1% | 4.6% |
| Standard Deviation (Sample) | 8.0% | 5.2% |
| Standard Deviation (Population) | 7.9% | 5.1% |
Similar Demographics by In Labor Force | Age 30-34
Demographics Similar to Poles by In Labor Force | Age 30-34
In terms of in labor force | age 30-34, the demographic groups most similar to Poles are Russian (85.5%, a difference of 0.0%), Immigrants from Turkey (85.5%, a difference of 0.010%), Czech (85.5%, a difference of 0.010%), Immigrants from Poland (85.5%, a difference of 0.010%), and Immigrants from Kenya (85.5%, a difference of 0.020%).
| Demographics | Rating | Rank | In Labor Force | Age 30-34 |
| Cape Verdeans | 99.7 /100 | #51 | Exceptional 85.6% |
| Slovenes | 99.7 /100 | #52 | Exceptional 85.6% |
| Filipinos | 99.6 /100 | #53 | Exceptional 85.5% |
| Immigrants | Kenya | 99.6 /100 | #54 | Exceptional 85.5% |
| Immigrants | Turkey | 99.6 /100 | #55 | Exceptional 85.5% |
| Czechs | 99.6 /100 | #56 | Exceptional 85.5% |
| Russians | 99.6 /100 | #57 | Exceptional 85.5% |
| Poles | 99.6 /100 | #58 | Exceptional 85.5% |
| Immigrants | Poland | 99.5 /100 | #59 | Exceptional 85.5% |
| Immigrants | France | 99.5 /100 | #60 | Exceptional 85.5% |
| Immigrants | Brazil | 99.5 /100 | #61 | Exceptional 85.5% |
| Soviet Union | 99.4 /100 | #62 | Exceptional 85.5% |
| Macedonians | 99.4 /100 | #63 | Exceptional 85.5% |
| Italians | 99.4 /100 | #64 | Exceptional 85.4% |
| Senegalese | 99.4 /100 | #65 | Exceptional 85.4% |
Demographics Similar to Immigrants from Jamaica by In Labor Force | Age 30-34
In terms of in labor force | age 30-34, the demographic groups most similar to Immigrants from Jamaica are Immigrants from Western Asia (84.3%, a difference of 0.010%), Arab (84.3%, a difference of 0.020%), Jamaican (84.3%, a difference of 0.020%), Indonesian (84.3%, a difference of 0.020%), and Japanese (84.3%, a difference of 0.020%).
| Demographics | Rating | Rank | In Labor Force | Age 30-34 |
| Lebanese | 10.6 /100 | #206 | Poor 84.4% |
| Bangladeshis | 9.4 /100 | #207 | Tragic 84.3% |
| Arabs | 8.9 /100 | #208 | Tragic 84.3% |
| Jamaicans | 8.8 /100 | #209 | Tragic 84.3% |
| Indonesians | 8.8 /100 | #210 | Tragic 84.3% |
| Japanese | 8.8 /100 | #211 | Tragic 84.3% |
| Immigrants | Western Asia | 8.2 /100 | #212 | Tragic 84.3% |
| Immigrants | Jamaica | 7.9 /100 | #213 | Tragic 84.3% |
| Immigrants | Germany | 7.2 /100 | #214 | Tragic 84.3% |
| Europeans | 7.2 /100 | #215 | Tragic 84.3% |
| Immigrants | Ecuador | 7.1 /100 | #216 | Tragic 84.3% |
| Immigrants | Trinidad and Tobago | 7.0 /100 | #217 | Tragic 84.3% |
| Immigrants | Panama | 6.3 /100 | #218 | Tragic 84.3% |
| Swiss | 5.8 /100 | #219 | Tragic 84.3% |
| Danes | 5.3 /100 | #220 | Tragic 84.3% |