Crow vs Honduran In Labor Force | Age 30-34
COMPARE
Crow
Honduran
In Labor Force | Age 30-34
In Labor Force | Age 30-34 Comparison
Crow
Hondurans
75.9%
IN LABOR FORCE | AGE 30-34
0.0/ 100
METRIC RATING
346th/ 347
METRIC RANK
83.8%
IN LABOR FORCE | AGE 30-34
0.3/ 100
METRIC RATING
258th/ 347
METRIC RANK
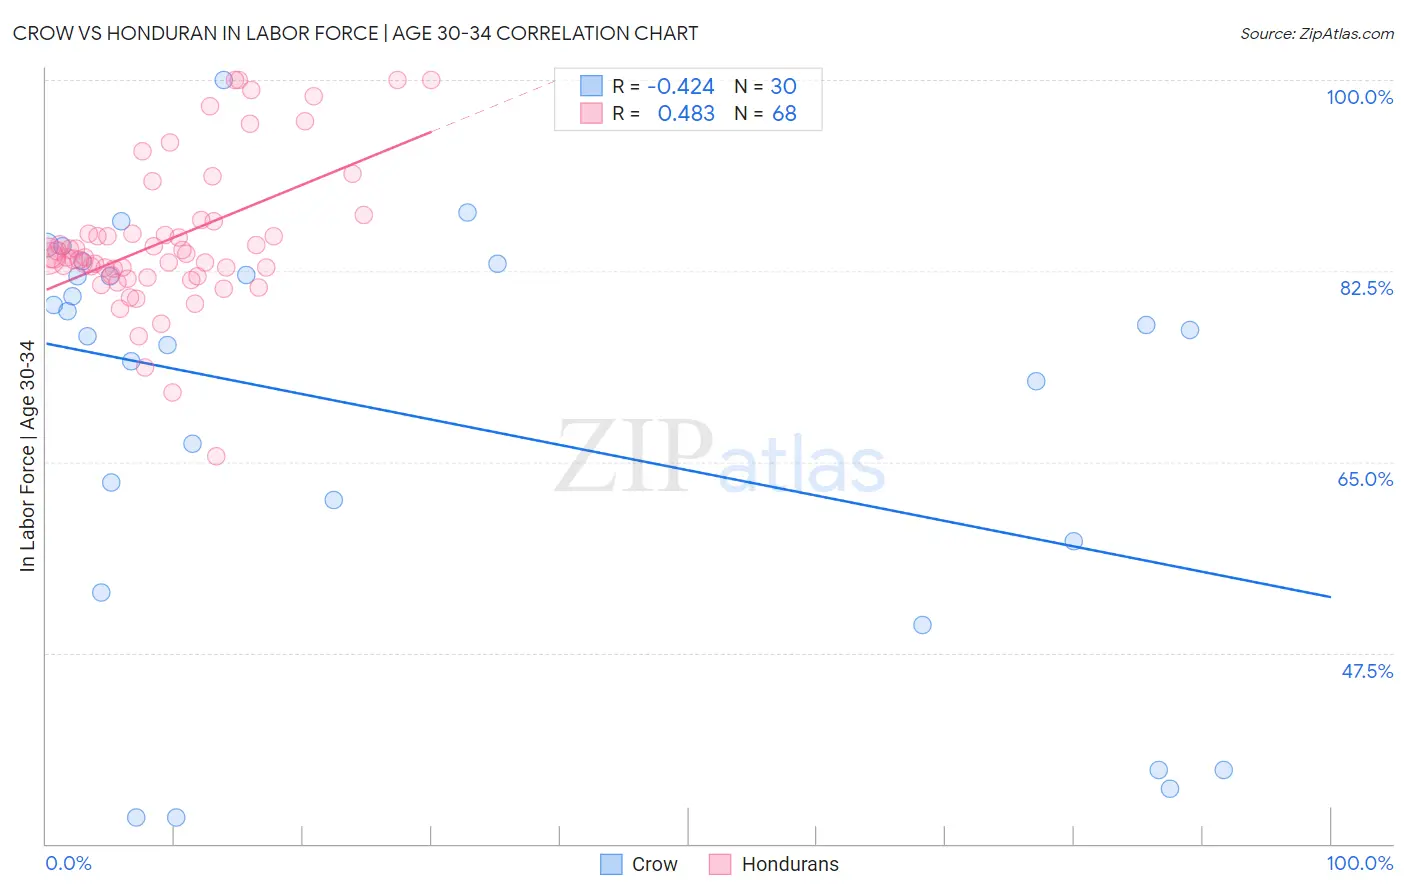
Crow vs Honduran In Labor Force | Age 30-34 Correlation Chart
The statistical analysis conducted on geographies consisting of 59,195,148 people shows a moderate negative correlation between the proportion of Crow and labor force participation rate among population between the ages 30 and 34 in the United States with a correlation coefficient (R) of -0.424 and weighted average of 75.9%. Similarly, the statistical analysis conducted on geographies consisting of 357,599,463 people shows a moderate positive correlation between the proportion of Hondurans and labor force participation rate among population between the ages 30 and 34 in the United States with a correlation coefficient (R) of 0.483 and weighted average of 83.8%, a difference of 10.4%.
In Labor Force | Age 30-34 Correlation Summary
| Measurement | Crow | Honduran |
| Minimum | 32.4% | 65.6% |
| Maximum | 100.0% | 100.0% |
| Range | 67.6% | 34.4% |
| Mean | 69.1% | 85.3% |
| Median | 76.8% | 83.8% |
| Interquartile 25% (IQ1) | 57.7% | 82.0% |
| Interquartile 75% (IQ3) | 82.1% | 86.5% |
| Interquartile Range (IQR) | 24.4% | 4.5% |
| Standard Deviation (Sample) | 19.0% | 6.8% |
| Standard Deviation (Population) | 18.6% | 6.7% |
Similar Demographics by In Labor Force | Age 30-34
Demographics Similar to Crow by In Labor Force | Age 30-34
In terms of in labor force | age 30-34, the demographic groups most similar to Crow are Yup'ik (76.4%, a difference of 0.68%), Yuman (77.1%, a difference of 1.5%), Lumbee (77.3%, a difference of 1.8%), Tohono O'odham (77.7%, a difference of 2.4%), and Navajo (73.8%, a difference of 2.9%).
| Demographics | Rating | Rank | In Labor Force | Age 30-34 |
| Inupiat | 0.0 /100 | #333 | Tragic 79.7% |
| Hopi | 0.0 /100 | #334 | Tragic 79.3% |
| Marshallese | 0.0 /100 | #335 | Tragic 79.2% |
| Natives/Alaskans | 0.0 /100 | #336 | Tragic 79.2% |
| Yakama | 0.0 /100 | #337 | Tragic 79.1% |
| Pima | 0.0 /100 | #338 | Tragic 79.0% |
| Apache | 0.0 /100 | #339 | Tragic 79.0% |
| Ute | 0.0 /100 | #340 | Tragic 78.9% |
| Immigrants | Yemen | 0.0 /100 | #341 | Tragic 78.2% |
| Tohono O'odham | 0.0 /100 | #342 | Tragic 77.7% |
| Lumbee | 0.0 /100 | #343 | Tragic 77.3% |
| Yuman | 0.0 /100 | #344 | Tragic 77.1% |
| Yup'ik | 0.0 /100 | #345 | Tragic 76.4% |
| Crow | 0.0 /100 | #346 | Tragic 75.9% |
| Navajo | 0.0 /100 | #347 | Tragic 73.8% |
Demographics Similar to Hondurans by In Labor Force | Age 30-34
In terms of in labor force | age 30-34, the demographic groups most similar to Hondurans are Scotch-Irish (83.8%, a difference of 0.0%), Immigrants from Dominican Republic (83.8%, a difference of 0.020%), Iraqi (83.8%, a difference of 0.030%), Guyanese (83.8%, a difference of 0.030%), and Immigrants from Lebanon (83.9%, a difference of 0.040%).
| Demographics | Rating | Rank | In Labor Force | Age 30-34 |
| Nicaraguans | 0.6 /100 | #251 | Tragic 83.9% |
| Bahamians | 0.6 /100 | #252 | Tragic 83.9% |
| Immigrants | Nicaragua | 0.6 /100 | #253 | Tragic 83.9% |
| Immigrants | St. Vincent and the Grenadines | 0.5 /100 | #254 | Tragic 83.9% |
| Whites/Caucasians | 0.5 /100 | #255 | Tragic 83.9% |
| Immigrants | Lebanon | 0.4 /100 | #256 | Tragic 83.9% |
| Iraqis | 0.3 /100 | #257 | Tragic 83.8% |
| Hondurans | 0.3 /100 | #258 | Tragic 83.8% |
| Scotch-Irish | 0.3 /100 | #259 | Tragic 83.8% |
| Immigrants | Dominican Republic | 0.3 /100 | #260 | Tragic 83.8% |
| Guyanese | 0.3 /100 | #261 | Tragic 83.8% |
| Dominicans | 0.2 /100 | #262 | Tragic 83.8% |
| Immigrants | Guyana | 0.2 /100 | #263 | Tragic 83.8% |
| Guatemalans | 0.2 /100 | #264 | Tragic 83.7% |
| Immigrants | Honduras | 0.1 /100 | #265 | Tragic 83.7% |