Crow vs Immigrants from Belarus In Labor Force | Age > 16
COMPARE
Crow
Immigrants from Belarus
In Labor Force | Age > 16
In Labor Force | Age > 16 Comparison
Crow
Immigrants from Belarus
60.8%
IN LABOR FORCE | AGE > 16
0.0/ 100
METRIC RATING
332nd/ 347
METRIC RANK
65.2%
IN LABOR FORCE | AGE > 16
66.0/ 100
METRIC RATING
167th/ 347
METRIC RANK
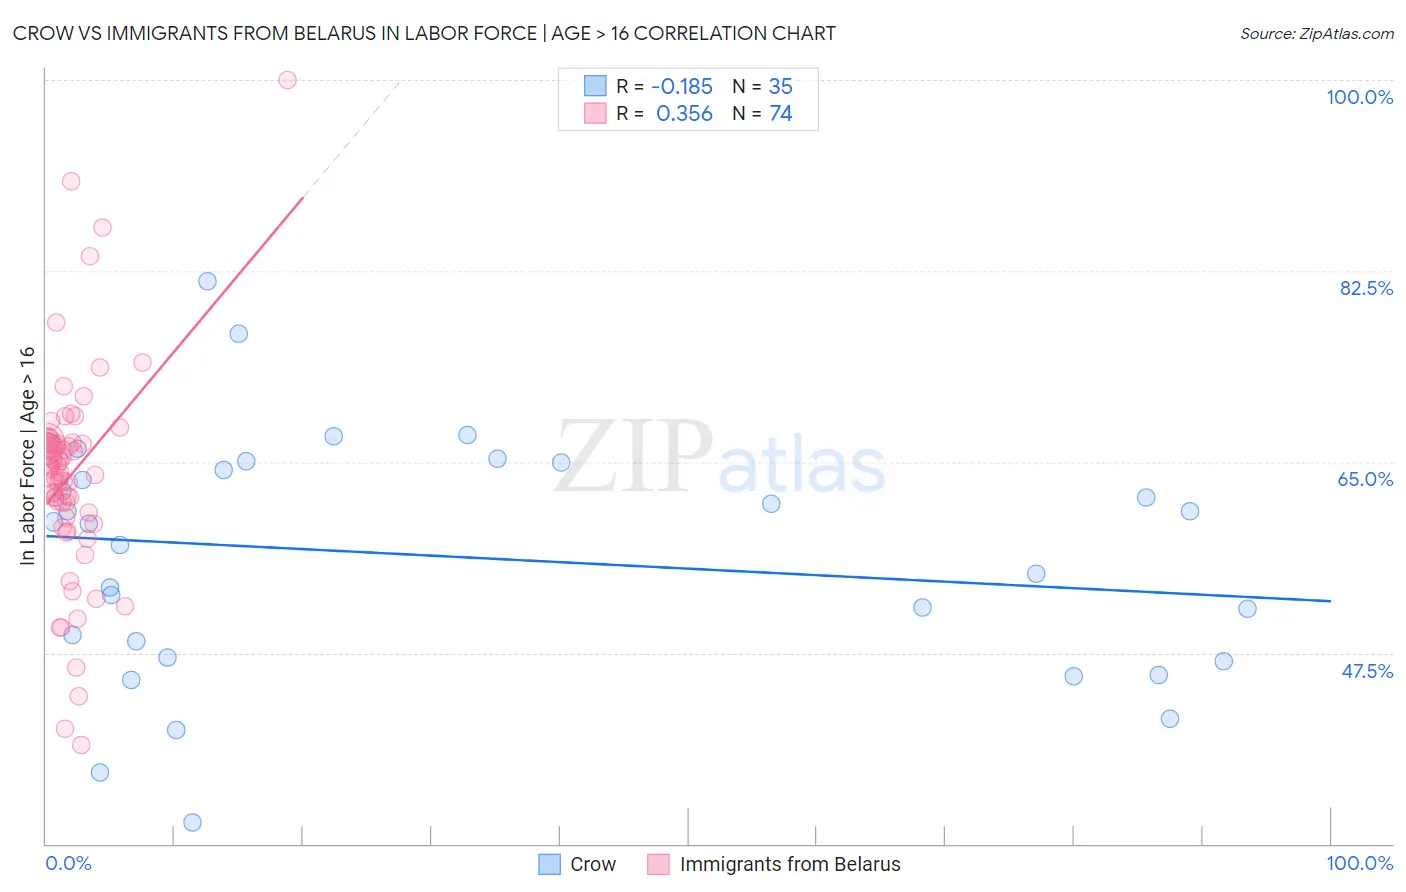
Crow vs Immigrants from Belarus In Labor Force | Age > 16 Correlation Chart
The statistical analysis conducted on geographies consisting of 59,204,758 people shows a poor negative correlation between the proportion of Crow and labor force participation rate among population ages 16 and over in the United States with a correlation coefficient (R) of -0.185 and weighted average of 60.8%. Similarly, the statistical analysis conducted on geographies consisting of 150,205,158 people shows a mild positive correlation between the proportion of Immigrants from Belarus and labor force participation rate among population ages 16 and over in the United States with a correlation coefficient (R) of 0.356 and weighted average of 65.2%, a difference of 7.3%.
In Labor Force | Age > 16 Correlation Summary
| Measurement | Crow | Immigrants from Belarus |
| Minimum | 31.9% | 39.1% |
| Maximum | 81.6% | 100.0% |
| Range | 49.7% | 60.9% |
| Mean | 56.4% | 63.8% |
| Median | 59.4% | 64.5% |
| Interquartile 25% (IQ1) | 47.1% | 60.4% |
| Interquartile 75% (IQ3) | 65.0% | 66.8% |
| Interquartile Range (IQR) | 17.9% | 6.4% |
| Standard Deviation (Sample) | 11.1% | 9.7% |
| Standard Deviation (Population) | 10.9% | 9.7% |
Similar Demographics by In Labor Force | Age > 16
Demographics Similar to Crow by In Labor Force | Age > 16
In terms of in labor force | age > 16, the demographic groups most similar to Crow are Paiute (60.7%, a difference of 0.080%), Apache (60.7%, a difference of 0.13%), Ute (60.9%, a difference of 0.17%), Native/Alaskan (60.6%, a difference of 0.31%), and Menominee (60.6%, a difference of 0.34%).
| Demographics | Rating | Rank | In Labor Force | Age > 16 |
| Cherokee | 0.0 /100 | #325 | Tragic 61.9% |
| Sioux | 0.0 /100 | #326 | Tragic 61.8% |
| Cajuns | 0.0 /100 | #327 | Tragic 61.8% |
| Dutch West Indians | 0.0 /100 | #328 | Tragic 61.7% |
| Choctaw | 0.0 /100 | #329 | Tragic 61.5% |
| Creek | 0.0 /100 | #330 | Tragic 61.3% |
| Ute | 0.0 /100 | #331 | Tragic 60.9% |
| Crow | 0.0 /100 | #332 | Tragic 60.8% |
| Paiute | 0.0 /100 | #333 | Tragic 60.7% |
| Apache | 0.0 /100 | #334 | Tragic 60.7% |
| Natives/Alaskans | 0.0 /100 | #335 | Tragic 60.6% |
| Menominee | 0.0 /100 | #336 | Tragic 60.6% |
| Colville | 0.0 /100 | #337 | Tragic 59.8% |
| Immigrants | Yemen | 0.0 /100 | #338 | Tragic 59.6% |
| Houma | 0.0 /100 | #339 | Tragic 59.5% |
Demographics Similar to Immigrants from Belarus by In Labor Force | Age > 16
In terms of in labor force | age > 16, the demographic groups most similar to Immigrants from Belarus are Immigrants from Western Asia (65.3%, a difference of 0.020%), Immigrants from Kazakhstan (65.3%, a difference of 0.030%), Serbian (65.2%, a difference of 0.030%), Danish (65.3%, a difference of 0.040%), and Arab (65.2%, a difference of 0.040%).
| Demographics | Rating | Rank | In Labor Force | Age > 16 |
| Immigrants | South Africa | 73.5 /100 | #160 | Good 65.3% |
| Australians | 71.3 /100 | #161 | Good 65.3% |
| Albanians | 70.8 /100 | #162 | Good 65.3% |
| South Africans | 69.8 /100 | #163 | Good 65.3% |
| Danes | 68.8 /100 | #164 | Good 65.3% |
| Immigrants | Kazakhstan | 68.1 /100 | #165 | Good 65.3% |
| Immigrants | Western Asia | 67.3 /100 | #166 | Good 65.3% |
| Immigrants | Belarus | 66.0 /100 | #167 | Good 65.2% |
| Serbians | 63.5 /100 | #168 | Good 65.2% |
| Arabs | 62.4 /100 | #169 | Good 65.2% |
| Immigrants | Israel | 61.7 /100 | #170 | Good 65.2% |
| Israelis | 61.6 /100 | #171 | Good 65.2% |
| Immigrants | Sweden | 61.3 /100 | #172 | Good 65.2% |
| Immigrants | Ukraine | 53.7 /100 | #173 | Average 65.1% |
| Macedonians | 50.0 /100 | #174 | Average 65.1% |