Crow vs Yaqui In Labor Force | Age > 16
COMPARE
Crow
Yaqui
In Labor Force | Age > 16
In Labor Force | Age > 16 Comparison
Crow
Yaqui
60.8%
IN LABOR FORCE | AGE > 16
0.0/ 100
METRIC RATING
332nd/ 347
METRIC RANK
63.0%
IN LABOR FORCE | AGE > 16
0.0/ 100
METRIC RATING
314th/ 347
METRIC RANK
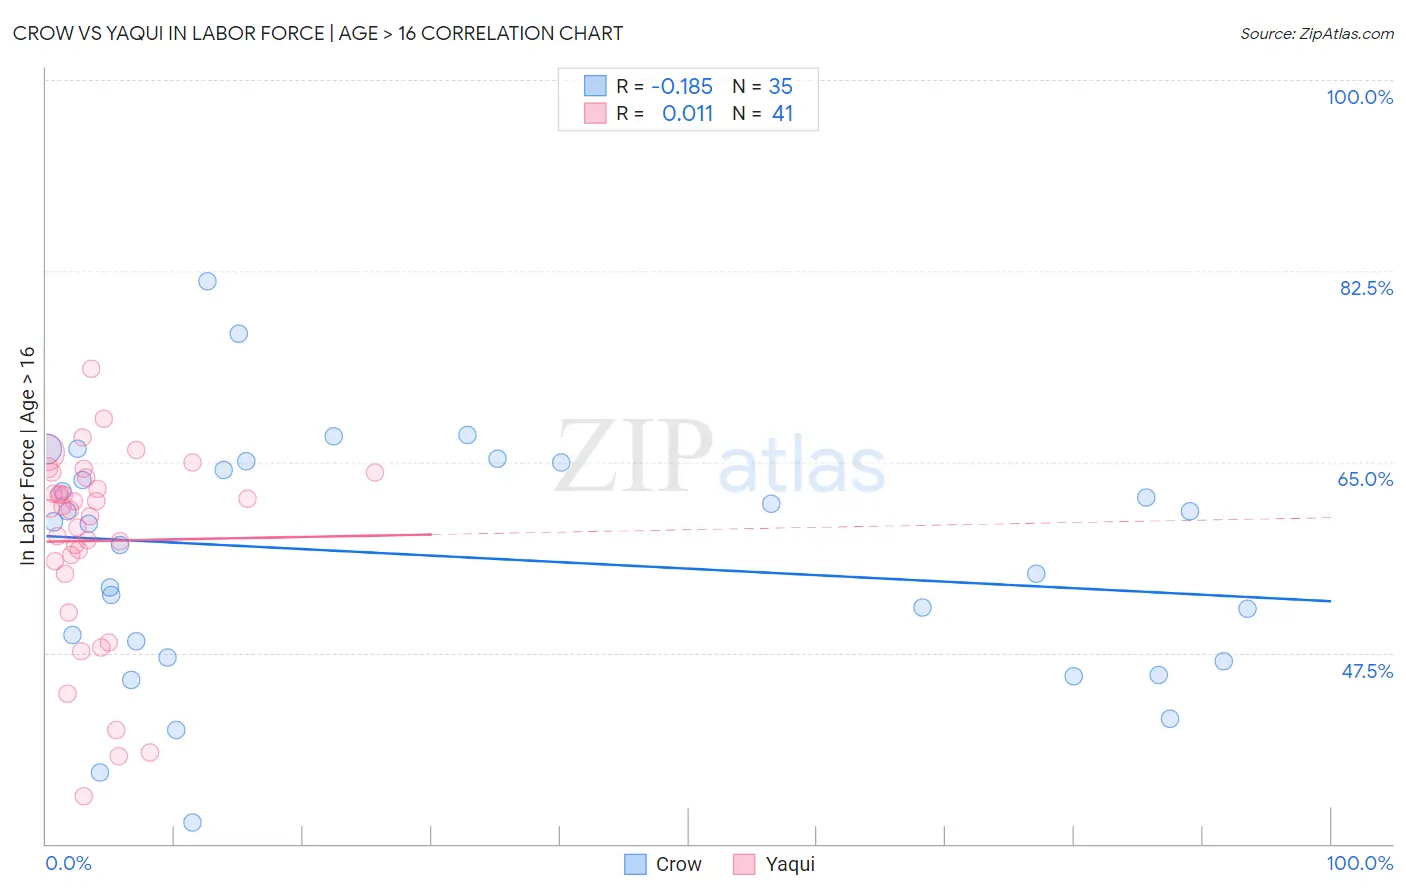
Crow vs Yaqui In Labor Force | Age > 16 Correlation Chart
The statistical analysis conducted on geographies consisting of 59,204,758 people shows a poor negative correlation between the proportion of Crow and labor force participation rate among population ages 16 and over in the United States with a correlation coefficient (R) of -0.185 and weighted average of 60.8%. Similarly, the statistical analysis conducted on geographies consisting of 107,721,250 people shows no correlation between the proportion of Yaqui and labor force participation rate among population ages 16 and over in the United States with a correlation coefficient (R) of 0.011 and weighted average of 63.0%, a difference of 3.7%.
In Labor Force | Age > 16 Correlation Summary
| Measurement | Crow | Yaqui |
| Minimum | 31.9% | 34.4% |
| Maximum | 81.6% | 73.5% |
| Range | 49.7% | 39.1% |
| Mean | 56.4% | 57.8% |
| Median | 59.4% | 60.7% |
| Interquartile 25% (IQ1) | 47.1% | 55.3% |
| Interquartile 75% (IQ3) | 65.0% | 63.8% |
| Interquartile Range (IQR) | 17.9% | 8.5% |
| Standard Deviation (Sample) | 11.1% | 8.9% |
| Standard Deviation (Population) | 10.9% | 8.8% |
Demographics Similar to Crow and Yaqui by In Labor Force | Age > 16
In terms of in labor force | age > 16, the demographic groups most similar to Crow are Paiute (60.7%, a difference of 0.080%), Ute (60.9%, a difference of 0.17%), Creek (61.3%, a difference of 0.89%), Choctaw (61.5%, a difference of 1.1%), and Dutch West Indian (61.7%, a difference of 1.5%). Similarly, the demographic groups most similar to Yaqui are Chippewa (63.1%, a difference of 0.10%), Potawatomi (62.8%, a difference of 0.35%), Yup'ik (62.7%, a difference of 0.56%), Kiowa (62.4%, a difference of 1.0%), and Chickasaw (62.3%, a difference of 1.2%).
| Demographics | Rating | Rank | In Labor Force | Age > 16 |
| Chippewa | 0.0 /100 | #313 | Tragic 63.1% |
| Yaqui | 0.0 /100 | #314 | Tragic 63.0% |
| Potawatomi | 0.0 /100 | #315 | Tragic 62.8% |
| Yup'ik | 0.0 /100 | #316 | Tragic 62.7% |
| Kiowa | 0.0 /100 | #317 | Tragic 62.4% |
| Chickasaw | 0.0 /100 | #318 | Tragic 62.3% |
| Arapaho | 0.0 /100 | #319 | Tragic 62.1% |
| Yakama | 0.0 /100 | #320 | Tragic 62.1% |
| Americans | 0.0 /100 | #321 | Tragic 62.1% |
| Ottawa | 0.0 /100 | #322 | Tragic 62.0% |
| Seminole | 0.0 /100 | #323 | Tragic 62.0% |
| Cheyenne | 0.0 /100 | #324 | Tragic 62.0% |
| Cherokee | 0.0 /100 | #325 | Tragic 61.9% |
| Sioux | 0.0 /100 | #326 | Tragic 61.8% |
| Cajuns | 0.0 /100 | #327 | Tragic 61.8% |
| Dutch West Indians | 0.0 /100 | #328 | Tragic 61.7% |
| Choctaw | 0.0 /100 | #329 | Tragic 61.5% |
| Creek | 0.0 /100 | #330 | Tragic 61.3% |
| Ute | 0.0 /100 | #331 | Tragic 60.9% |
| Crow | 0.0 /100 | #332 | Tragic 60.8% |
| Paiute | 0.0 /100 | #333 | Tragic 60.7% |