Costa Rican vs Syrian In Labor Force | Age 20-64
COMPARE
Costa Rican
Syrian
In Labor Force | Age 20-64
In Labor Force | Age 20-64 Comparison
Costa Ricans
Syrians
79.7%
IN LABOR FORCE | AGE 20-64
72.4/ 100
METRIC RATING
150th/ 347
METRIC RANK
79.6%
IN LABOR FORCE | AGE 20-64
50.0/ 100
METRIC RATING
174th/ 347
METRIC RANK
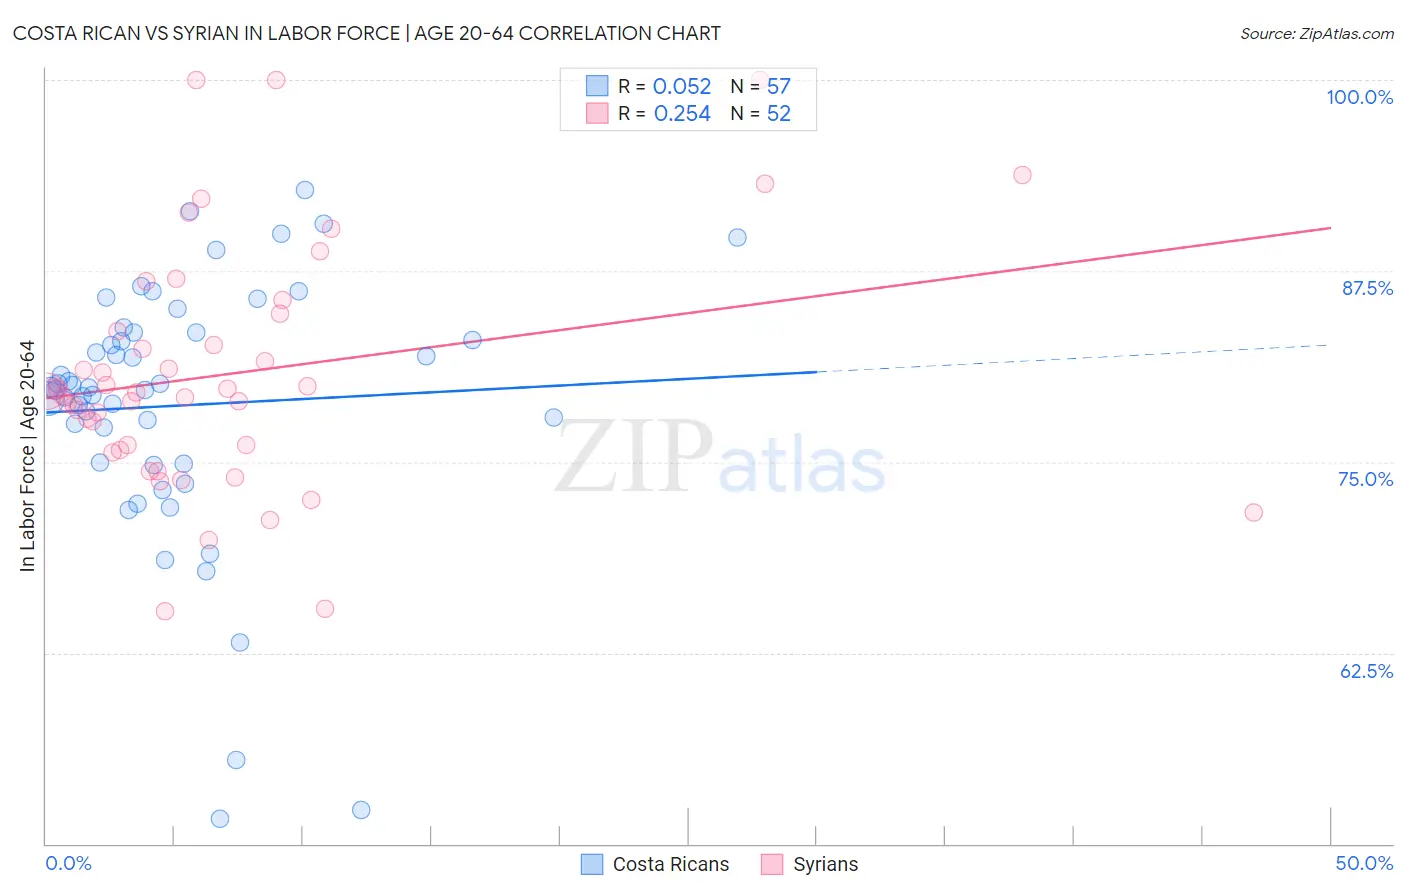
Costa Rican vs Syrian In Labor Force | Age 20-64 Correlation Chart
The statistical analysis conducted on geographies consisting of 253,602,231 people shows a slight positive correlation between the proportion of Costa Ricans and labor force participation rate among population between the ages 20 and 64 in the United States with a correlation coefficient (R) of 0.052 and weighted average of 79.7%. Similarly, the statistical analysis conducted on geographies consisting of 266,330,303 people shows a weak positive correlation between the proportion of Syrians and labor force participation rate among population between the ages 20 and 64 in the United States with a correlation coefficient (R) of 0.254 and weighted average of 79.6%, a difference of 0.19%.
In Labor Force | Age 20-64 Correlation Summary
| Measurement | Costa Rican | Syrian |
| Minimum | 51.6% | 65.2% |
| Maximum | 92.8% | 100.0% |
| Range | 41.2% | 34.8% |
| Mean | 78.7% | 80.8% |
| Median | 79.9% | 79.6% |
| Interquartile 25% (IQ1) | 74.9% | 75.9% |
| Interquartile 75% (IQ3) | 83.5% | 84.1% |
| Interquartile Range (IQR) | 8.6% | 8.2% |
| Standard Deviation (Sample) | 8.6% | 7.9% |
| Standard Deviation (Population) | 8.5% | 7.8% |
Similar Demographics by In Labor Force | Age 20-64
Demographics Similar to Costa Ricans by In Labor Force | Age 20-64
In terms of in labor force | age 20-64, the demographic groups most similar to Costa Ricans are Scandinavian (79.7%, a difference of 0.0%), Immigrants from Northern Europe (79.7%, a difference of 0.0%), Icelander (79.7%, a difference of 0.030%), Immigrants from Kazakhstan (79.7%, a difference of 0.030%), and New Zealander (79.7%, a difference of 0.030%).
| Demographics | Rating | Rank | In Labor Force | Age 20-64 |
| Immigrants | Sweden | 79.7 /100 | #143 | Good 79.8% |
| Koreans | 79.6 /100 | #144 | Good 79.8% |
| Pakistanis | 79.3 /100 | #145 | Good 79.8% |
| Immigrants | Southern Europe | 78.9 /100 | #146 | Good 79.8% |
| Immigrants | Philippines | 78.0 /100 | #147 | Good 79.8% |
| Romanians | 77.6 /100 | #148 | Good 79.8% |
| Icelanders | 75.1 /100 | #149 | Good 79.7% |
| Costa Ricans | 72.4 /100 | #150 | Good 79.7% |
| Scandinavians | 72.0 /100 | #151 | Good 79.7% |
| Immigrants | Northern Europe | 72.0 /100 | #152 | Good 79.7% |
| Immigrants | Kazakhstan | 69.5 /100 | #153 | Good 79.7% |
| New Zealanders | 69.4 /100 | #154 | Good 79.7% |
| Immigrants | South Africa | 69.2 /100 | #155 | Good 79.7% |
| Senegalese | 69.1 /100 | #156 | Good 79.7% |
| Immigrants | China | 69.1 /100 | #157 | Good 79.7% |
Demographics Similar to Syrians by In Labor Force | Age 20-64
In terms of in labor force | age 20-64, the demographic groups most similar to Syrians are Immigrants from Scotland (79.6%, a difference of 0.020%), Slavic (79.6%, a difference of 0.030%), Immigrants from Switzerland (79.6%, a difference of 0.030%), Immigrants from Belgium (79.6%, a difference of 0.030%), and Cuban (79.5%, a difference of 0.030%).
| Demographics | Rating | Rank | In Labor Force | Age 20-64 |
| Immigrants | Iraq | 62.0 /100 | #167 | Good 79.6% |
| Immigrants | Indonesia | 61.8 /100 | #168 | Good 79.6% |
| Laotians | 58.4 /100 | #169 | Average 79.6% |
| Slavs | 54.0 /100 | #170 | Average 79.6% |
| Immigrants | Switzerland | 53.3 /100 | #171 | Average 79.6% |
| Immigrants | Belgium | 53.1 /100 | #172 | Average 79.6% |
| Immigrants | Scotland | 52.4 /100 | #173 | Average 79.6% |
| Syrians | 50.0 /100 | #174 | Average 79.6% |
| Cubans | 46.1 /100 | #175 | Average 79.5% |
| Australians | 46.0 /100 | #176 | Average 79.5% |
| Immigrants | Netherlands | 45.2 /100 | #177 | Average 79.5% |
| Czechoslovakians | 44.3 /100 | #178 | Average 79.5% |
| Armenians | 41.4 /100 | #179 | Average 79.5% |
| Salvadorans | 41.0 /100 | #180 | Average 79.5% |
| Immigrants | Saudi Arabia | 37.7 /100 | #181 | Fair 79.5% |