Costa Rican vs Syrian 2 or more Vehicles in Household
COMPARE
Costa Rican
Syrian
2 or more Vehicles in Household
2 or more Vehicles in Household Comparison
Costa Ricans
Syrians
56.9%
2 OR MORE VEHICLES IN HOUSEHOLD
94.7/ 100
METRIC RATING
120th/ 347
METRIC RANK
56.2%
2 OR MORE VEHICLES IN HOUSEHOLD
81.2/ 100
METRIC RATING
145th/ 347
METRIC RANK
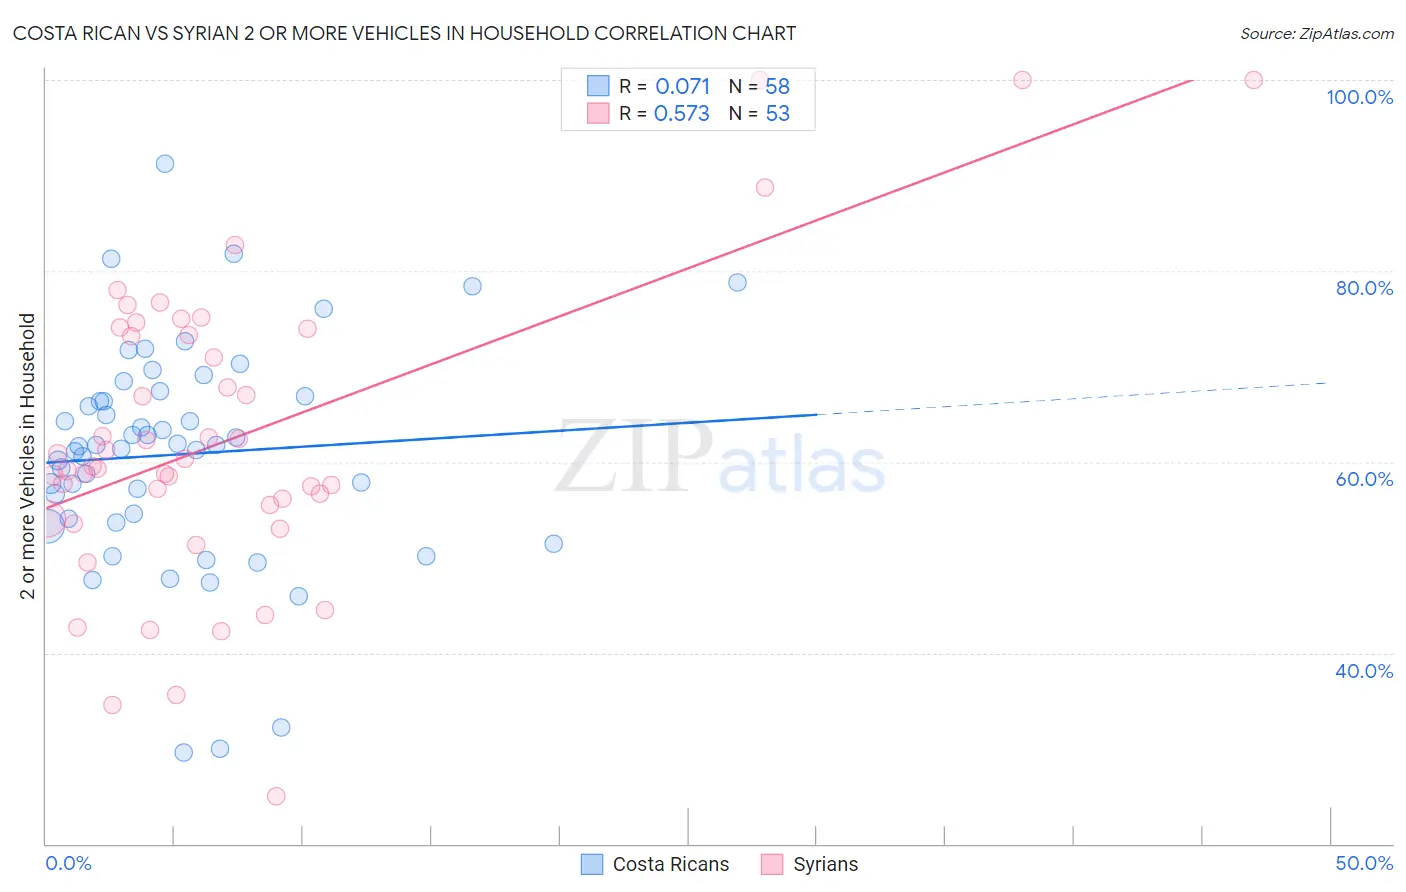
Costa Rican vs Syrian 2 or more Vehicles in Household Correlation Chart
The statistical analysis conducted on geographies consisting of 253,480,816 people shows a slight positive correlation between the proportion of Costa Ricans and percentage of households with 2 or more vehicles available in the United States with a correlation coefficient (R) of 0.071 and weighted average of 56.9%. Similarly, the statistical analysis conducted on geographies consisting of 266,212,507 people shows a substantial positive correlation between the proportion of Syrians and percentage of households with 2 or more vehicles available in the United States with a correlation coefficient (R) of 0.573 and weighted average of 56.2%, a difference of 1.4%.
2 or more Vehicles in Household Correlation Summary
| Measurement | Costa Rican | Syrian |
| Minimum | 29.5% | 25.0% |
| Maximum | 91.2% | 100.0% |
| Range | 61.7% | 75.0% |
| Mean | 60.8% | 62.4% |
| Median | 61.7% | 59.5% |
| Interquartile 25% (IQ1) | 54.0% | 54.8% |
| Interquartile 75% (IQ3) | 66.8% | 73.6% |
| Interquartile Range (IQR) | 12.8% | 18.8% |
| Standard Deviation (Sample) | 11.7% | 15.6% |
| Standard Deviation (Population) | 11.6% | 15.5% |
Similar Demographics by 2 or more Vehicles in Household
Demographics Similar to Costa Ricans by 2 or more Vehicles in Household
In terms of 2 or more vehicles in household, the demographic groups most similar to Costa Ricans are Native/Alaskan (57.0%, a difference of 0.050%), Asian (57.0%, a difference of 0.070%), Sioux (56.8%, a difference of 0.17%), Iraqi (57.1%, a difference of 0.24%), and Immigrants from South Africa (56.7%, a difference of 0.37%).
| Demographics | Rating | Rank | 2 or more Vehicles in Household |
| Zimbabweans | 96.9 /100 | #113 | Exceptional 57.2% |
| Immigrants | Lebanon | 96.8 /100 | #114 | Exceptional 57.2% |
| Chippewa | 96.6 /100 | #115 | Exceptional 57.2% |
| Immigrants | Jordan | 96.6 /100 | #116 | Exceptional 57.2% |
| Iraqis | 95.8 /100 | #117 | Exceptional 57.1% |
| Asians | 95.1 /100 | #118 | Exceptional 57.0% |
| Natives/Alaskans | 95.0 /100 | #119 | Exceptional 57.0% |
| Costa Ricans | 94.7 /100 | #120 | Exceptional 56.9% |
| Sioux | 93.8 /100 | #121 | Exceptional 56.8% |
| Immigrants | South Africa | 92.5 /100 | #122 | Exceptional 56.7% |
| Australians | 91.8 /100 | #123 | Exceptional 56.7% |
| New Zealanders | 91.8 /100 | #124 | Exceptional 56.7% |
| Tsimshian | 91.6 /100 | #125 | Exceptional 56.7% |
| Estonians | 90.9 /100 | #126 | Exceptional 56.6% |
| Immigrants | Thailand | 90.7 /100 | #127 | Exceptional 56.6% |
Demographics Similar to Syrians by 2 or more Vehicles in Household
In terms of 2 or more vehicles in household, the demographic groups most similar to Syrians are Immigrants from Syria (56.2%, a difference of 0.010%), Seminole (56.2%, a difference of 0.030%), Venezuelan (56.1%, a difference of 0.030%), Serbian (56.1%, a difference of 0.060%), and Immigrants from Moldova (56.1%, a difference of 0.060%).
| Demographics | Rating | Rank | 2 or more Vehicles in Household |
| Salvadorans | 84.7 /100 | #138 | Excellent 56.3% |
| Armenians | 84.3 /100 | #139 | Excellent 56.3% |
| Latvians | 83.6 /100 | #140 | Excellent 56.2% |
| Immigrants | Cambodia | 83.6 /100 | #141 | Excellent 56.2% |
| South Africans | 83.1 /100 | #142 | Excellent 56.2% |
| Seminole | 81.7 /100 | #143 | Excellent 56.2% |
| Immigrants | Syria | 81.4 /100 | #144 | Excellent 56.2% |
| Syrians | 81.2 /100 | #145 | Excellent 56.2% |
| Venezuelans | 80.7 /100 | #146 | Excellent 56.1% |
| Serbians | 80.3 /100 | #147 | Excellent 56.1% |
| Immigrants | Moldova | 80.2 /100 | #148 | Excellent 56.1% |
| Chileans | 80.2 /100 | #149 | Excellent 56.1% |
| Nicaraguans | 79.9 /100 | #150 | Good 56.1% |
| Immigrants | Northern Europe | 78.7 /100 | #151 | Good 56.1% |
| Immigrants | Pakistan | 78.1 /100 | #152 | Good 56.1% |