Chippewa vs Syrian In Labor Force | Age 20-64
COMPARE
Chippewa
Syrian
In Labor Force | Age 20-64
In Labor Force | Age 20-64 Comparison
Chippewa
Syrians
77.3%
IN LABOR FORCE | AGE 20-64
0.0/ 100
METRIC RATING
303rd/ 347
METRIC RANK
79.6%
IN LABOR FORCE | AGE 20-64
50.0/ 100
METRIC RATING
174th/ 347
METRIC RANK
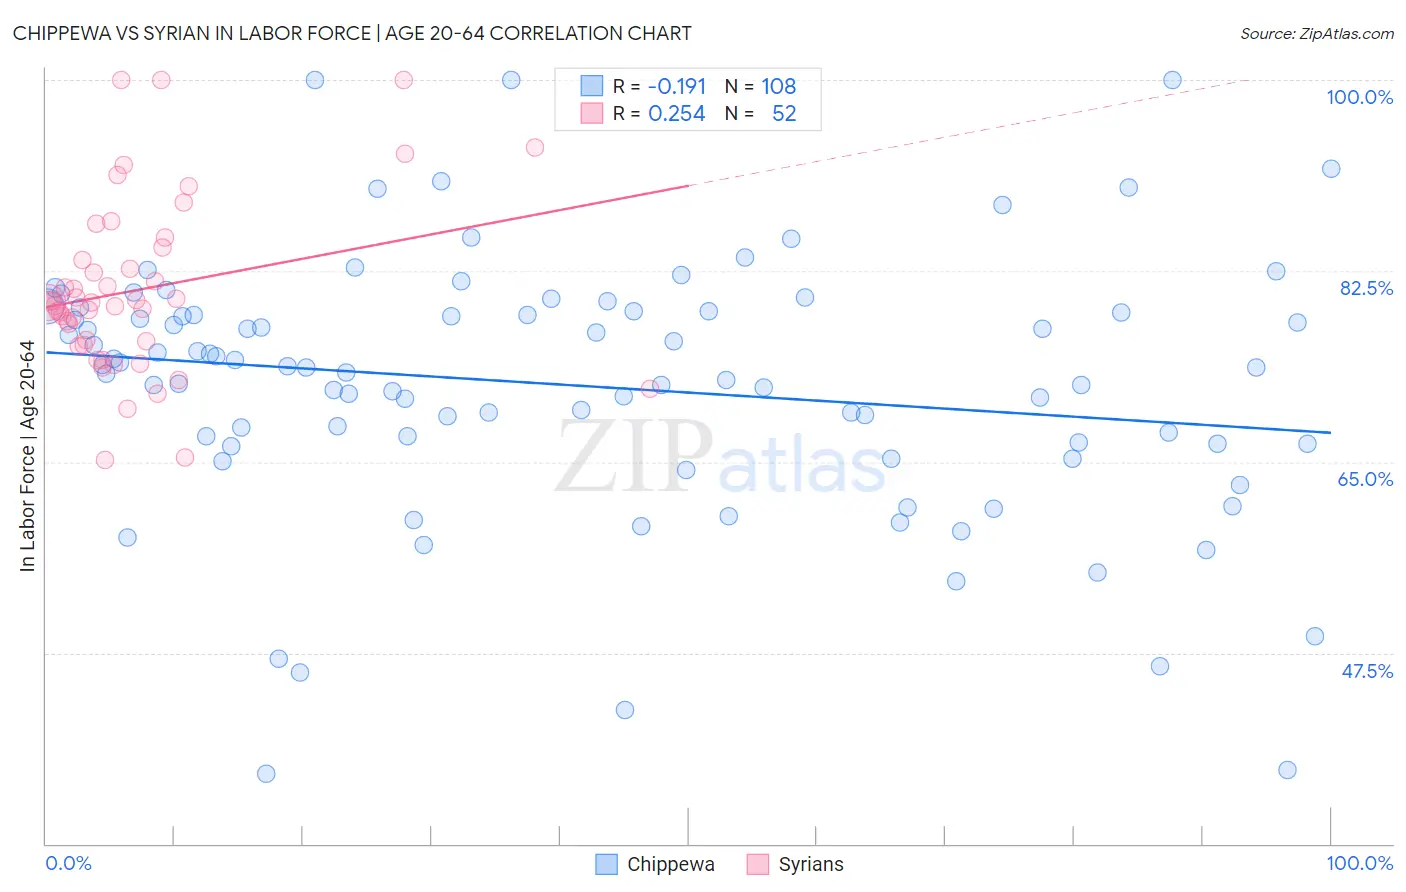
Chippewa vs Syrian In Labor Force | Age 20-64 Correlation Chart
The statistical analysis conducted on geographies consisting of 215,053,838 people shows a poor negative correlation between the proportion of Chippewa and labor force participation rate among population between the ages 20 and 64 in the United States with a correlation coefficient (R) of -0.191 and weighted average of 77.3%. Similarly, the statistical analysis conducted on geographies consisting of 266,330,303 people shows a weak positive correlation between the proportion of Syrians and labor force participation rate among population between the ages 20 and 64 in the United States with a correlation coefficient (R) of 0.254 and weighted average of 79.6%, a difference of 2.9%.
In Labor Force | Age 20-64 Correlation Summary
| Measurement | Chippewa | Syrian |
| Minimum | 36.4% | 65.2% |
| Maximum | 100.0% | 100.0% |
| Range | 63.6% | 34.8% |
| Mean | 72.0% | 80.8% |
| Median | 73.6% | 79.6% |
| Interquartile 25% (IQ1) | 66.7% | 75.9% |
| Interquartile 75% (IQ3) | 78.7% | 84.1% |
| Interquartile Range (IQR) | 12.0% | 8.2% |
| Standard Deviation (Sample) | 11.9% | 7.9% |
| Standard Deviation (Population) | 11.9% | 7.8% |
Similar Demographics by In Labor Force | Age 20-64
Demographics Similar to Chippewa by In Labor Force | Age 20-64
In terms of in labor force | age 20-64, the demographic groups most similar to Chippewa are Immigrants from Mexico (77.3%, a difference of 0.070%), Mexican (77.2%, a difference of 0.11%), Potawatomi (77.2%, a difference of 0.12%), Iroquois (77.5%, a difference of 0.22%), and Nepalese (77.5%, a difference of 0.27%).
| Demographics | Rating | Rank | In Labor Force | Age 20-64 |
| Immigrants | Dominican Republic | 0.0 /100 | #296 | Tragic 77.7% |
| Dominicans | 0.0 /100 | #297 | Tragic 77.7% |
| Cree | 0.0 /100 | #298 | Tragic 77.7% |
| Hispanics or Latinos | 0.0 /100 | #299 | Tragic 77.6% |
| Spanish American Indians | 0.0 /100 | #300 | Tragic 77.6% |
| Nepalese | 0.0 /100 | #301 | Tragic 77.5% |
| Iroquois | 0.0 /100 | #302 | Tragic 77.5% |
| Chippewa | 0.0 /100 | #303 | Tragic 77.3% |
| Immigrants | Mexico | 0.0 /100 | #304 | Tragic 77.3% |
| Mexicans | 0.0 /100 | #305 | Tragic 77.2% |
| Potawatomi | 0.0 /100 | #306 | Tragic 77.2% |
| Central American Indians | 0.0 /100 | #307 | Tragic 77.1% |
| Alaska Natives | 0.0 /100 | #308 | Tragic 77.0% |
| Americans | 0.0 /100 | #309 | Tragic 77.0% |
| Comanche | 0.0 /100 | #310 | Tragic 77.0% |
Demographics Similar to Syrians by In Labor Force | Age 20-64
In terms of in labor force | age 20-64, the demographic groups most similar to Syrians are Immigrants from Scotland (79.6%, a difference of 0.020%), Slavic (79.6%, a difference of 0.030%), Immigrants from Switzerland (79.6%, a difference of 0.030%), Immigrants from Belgium (79.6%, a difference of 0.030%), and Cuban (79.5%, a difference of 0.030%).
| Demographics | Rating | Rank | In Labor Force | Age 20-64 |
| Immigrants | Iraq | 62.0 /100 | #167 | Good 79.6% |
| Immigrants | Indonesia | 61.8 /100 | #168 | Good 79.6% |
| Laotians | 58.4 /100 | #169 | Average 79.6% |
| Slavs | 54.0 /100 | #170 | Average 79.6% |
| Immigrants | Switzerland | 53.3 /100 | #171 | Average 79.6% |
| Immigrants | Belgium | 53.1 /100 | #172 | Average 79.6% |
| Immigrants | Scotland | 52.4 /100 | #173 | Average 79.6% |
| Syrians | 50.0 /100 | #174 | Average 79.6% |
| Cubans | 46.1 /100 | #175 | Average 79.5% |
| Australians | 46.0 /100 | #176 | Average 79.5% |
| Immigrants | Netherlands | 45.2 /100 | #177 | Average 79.5% |
| Czechoslovakians | 44.3 /100 | #178 | Average 79.5% |
| Armenians | 41.4 /100 | #179 | Average 79.5% |
| Salvadorans | 41.0 /100 | #180 | Average 79.5% |
| Immigrants | Saudi Arabia | 37.7 /100 | #181 | Fair 79.5% |