Costa Rican vs British West Indian In Labor Force | Age 20-64
COMPARE
Costa Rican
British West Indian
In Labor Force | Age 20-64
In Labor Force | Age 20-64 Comparison
Costa Ricans
British West Indians
79.7%
IN LABOR FORCE | AGE 20-64
72.4/ 100
METRIC RATING
150th/ 347
METRIC RANK
78.4%
IN LABOR FORCE | AGE 20-64
0.1/ 100
METRIC RATING
265th/ 347
METRIC RANK
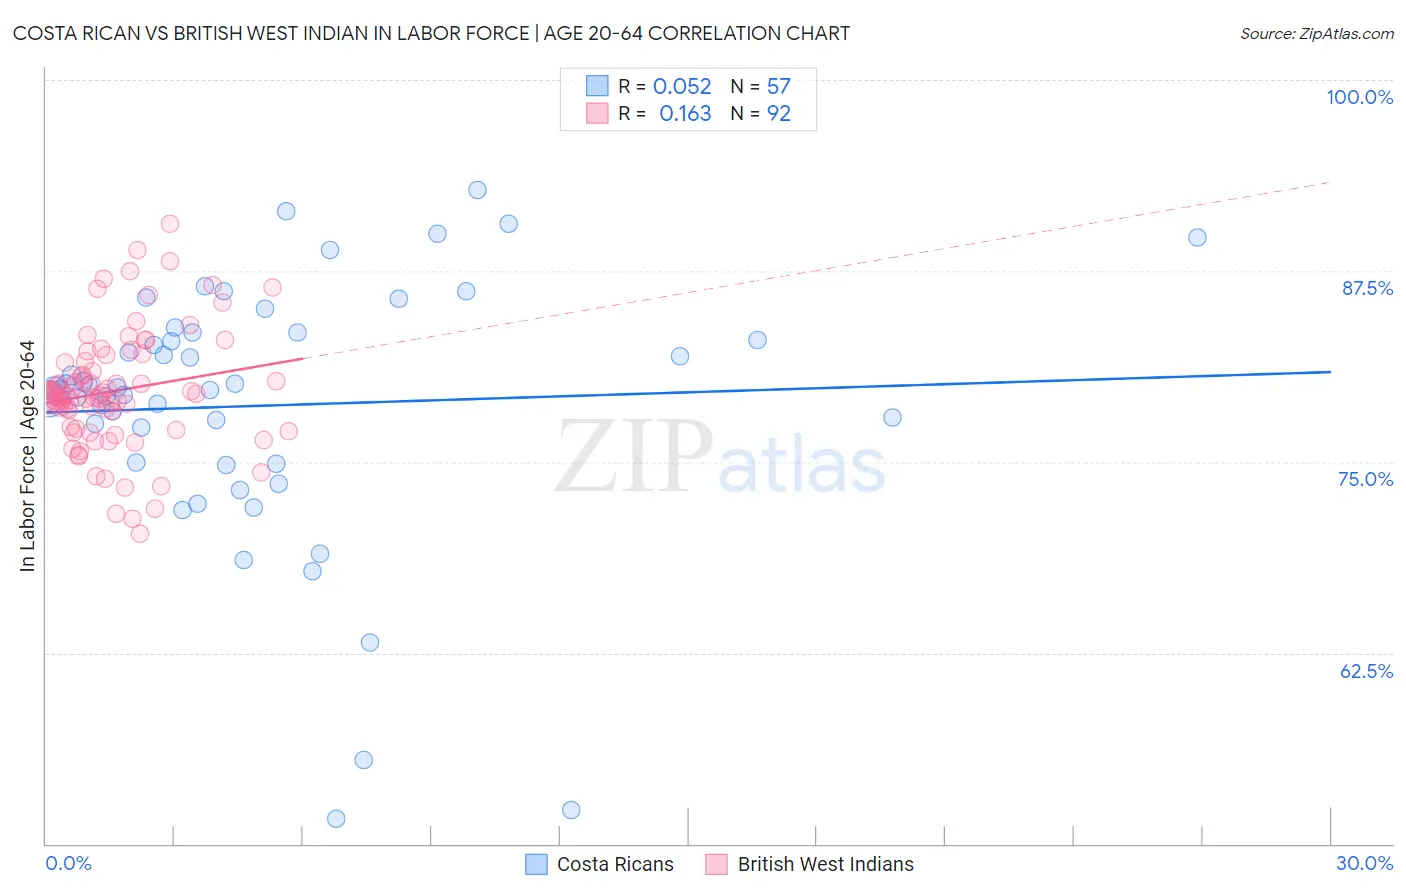
Costa Rican vs British West Indian In Labor Force | Age 20-64 Correlation Chart
The statistical analysis conducted on geographies consisting of 253,602,231 people shows a slight positive correlation between the proportion of Costa Ricans and labor force participation rate among population between the ages 20 and 64 in the United States with a correlation coefficient (R) of 0.052 and weighted average of 79.7%. Similarly, the statistical analysis conducted on geographies consisting of 152,617,449 people shows a poor positive correlation between the proportion of British West Indians and labor force participation rate among population between the ages 20 and 64 in the United States with a correlation coefficient (R) of 0.163 and weighted average of 78.4%, a difference of 1.7%.
In Labor Force | Age 20-64 Correlation Summary
| Measurement | Costa Rican | British West Indian |
| Minimum | 51.6% | 70.3% |
| Maximum | 92.8% | 90.6% |
| Range | 41.2% | 20.3% |
| Mean | 78.7% | 79.6% |
| Median | 79.9% | 79.4% |
| Interquartile 25% (IQ1) | 74.9% | 77.2% |
| Interquartile 75% (IQ3) | 83.5% | 81.5% |
| Interquartile Range (IQR) | 8.6% | 4.3% |
| Standard Deviation (Sample) | 8.6% | 3.9% |
| Standard Deviation (Population) | 8.5% | 3.9% |
Similar Demographics by In Labor Force | Age 20-64
Demographics Similar to Costa Ricans by In Labor Force | Age 20-64
In terms of in labor force | age 20-64, the demographic groups most similar to Costa Ricans are Scandinavian (79.7%, a difference of 0.0%), Immigrants from Northern Europe (79.7%, a difference of 0.0%), Icelander (79.7%, a difference of 0.030%), Immigrants from Kazakhstan (79.7%, a difference of 0.030%), and New Zealander (79.7%, a difference of 0.030%).
| Demographics | Rating | Rank | In Labor Force | Age 20-64 |
| Immigrants | Sweden | 79.7 /100 | #143 | Good 79.8% |
| Koreans | 79.6 /100 | #144 | Good 79.8% |
| Pakistanis | 79.3 /100 | #145 | Good 79.8% |
| Immigrants | Southern Europe | 78.9 /100 | #146 | Good 79.8% |
| Immigrants | Philippines | 78.0 /100 | #147 | Good 79.8% |
| Romanians | 77.6 /100 | #148 | Good 79.8% |
| Icelanders | 75.1 /100 | #149 | Good 79.7% |
| Costa Ricans | 72.4 /100 | #150 | Good 79.7% |
| Scandinavians | 72.0 /100 | #151 | Good 79.7% |
| Immigrants | Northern Europe | 72.0 /100 | #152 | Good 79.7% |
| Immigrants | Kazakhstan | 69.5 /100 | #153 | Good 79.7% |
| New Zealanders | 69.4 /100 | #154 | Good 79.7% |
| Immigrants | South Africa | 69.2 /100 | #155 | Good 79.7% |
| Senegalese | 69.1 /100 | #156 | Good 79.7% |
| Immigrants | China | 69.1 /100 | #157 | Good 79.7% |
Demographics Similar to British West Indians by In Labor Force | Age 20-64
In terms of in labor force | age 20-64, the demographic groups most similar to British West Indians are Bahamian (78.4%, a difference of 0.010%), U.S. Virgin Islander (78.4%, a difference of 0.030%), Spaniard (78.4%, a difference of 0.040%), Pennsylvania German (78.4%, a difference of 0.050%), and West Indian (78.3%, a difference of 0.050%).
| Demographics | Rating | Rank | In Labor Force | Age 20-64 |
| Immigrants | Guatemala | 0.4 /100 | #258 | Tragic 78.7% |
| Tsimshian | 0.4 /100 | #259 | Tragic 78.7% |
| Immigrants | Fiji | 0.3 /100 | #260 | Tragic 78.6% |
| Whites/Caucasians | 0.2 /100 | #261 | Tragic 78.5% |
| Fijians | 0.1 /100 | #262 | Tragic 78.4% |
| Pennsylvania Germans | 0.1 /100 | #263 | Tragic 78.4% |
| Spaniards | 0.1 /100 | #264 | Tragic 78.4% |
| British West Indians | 0.1 /100 | #265 | Tragic 78.4% |
| Bahamians | 0.1 /100 | #266 | Tragic 78.4% |
| U.S. Virgin Islanders | 0.1 /100 | #267 | Tragic 78.4% |
| West Indians | 0.0 /100 | #268 | Tragic 78.3% |
| Immigrants | Barbados | 0.0 /100 | #269 | Tragic 78.3% |
| Scotch-Irish | 0.0 /100 | #270 | Tragic 78.3% |
| Immigrants | Latin America | 0.0 /100 | #271 | Tragic 78.3% |
| Marshallese | 0.0 /100 | #272 | Tragic 78.3% |