Costa Rican vs Immigrants from Korea In Labor Force | Age 20-64
COMPARE
Costa Rican
Immigrants from Korea
In Labor Force | Age 20-64
In Labor Force | Age 20-64 Comparison
Costa Ricans
Immigrants from Korea
79.7%
IN LABOR FORCE | AGE 20-64
72.4/ 100
METRIC RATING
150th/ 347
METRIC RANK
80.3%
IN LABOR FORCE | AGE 20-64
98.8/ 100
METRIC RATING
63rd/ 347
METRIC RANK
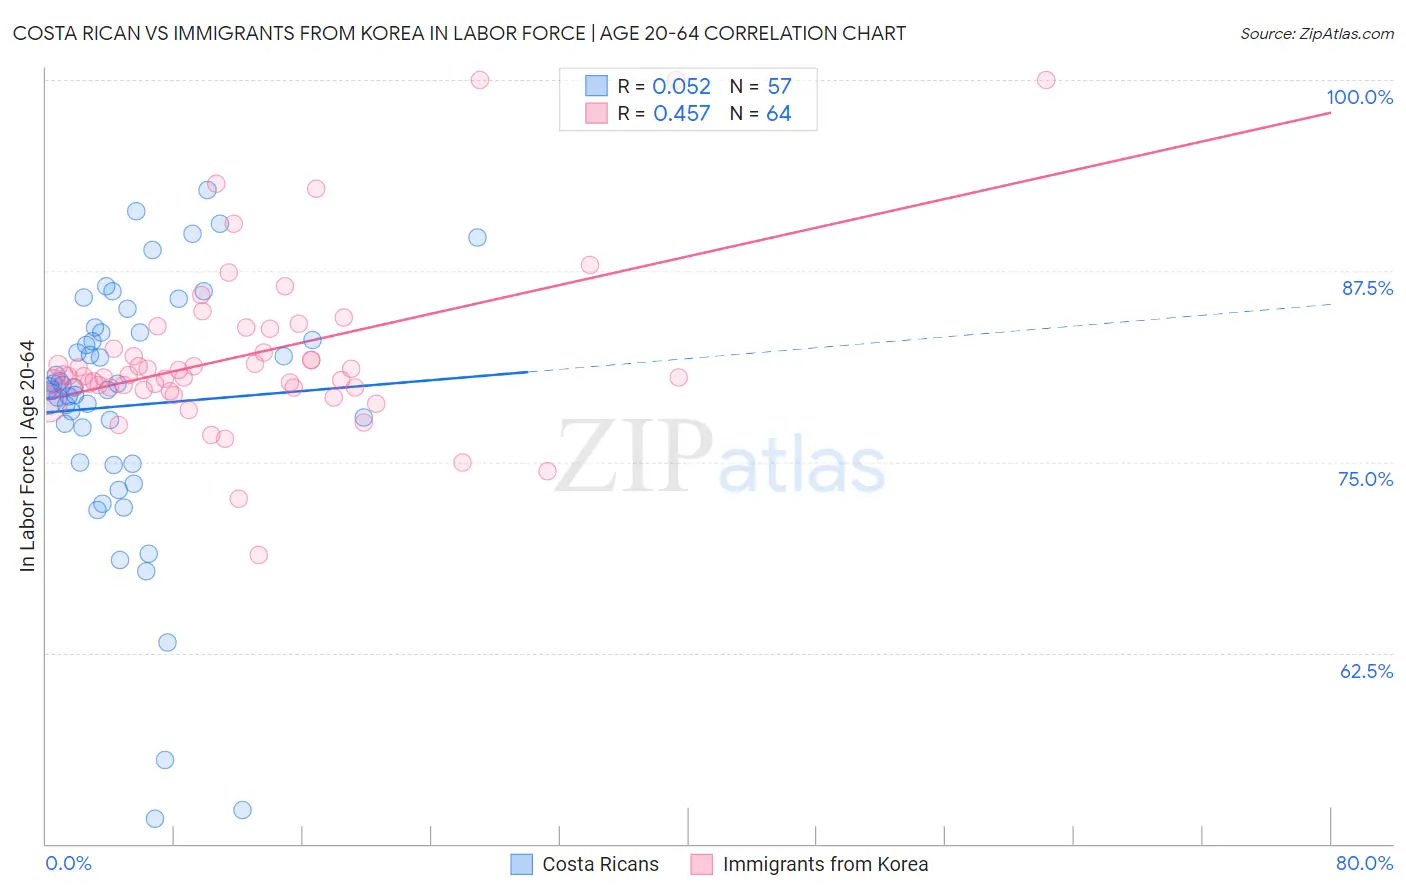
Costa Rican vs Immigrants from Korea In Labor Force | Age 20-64 Correlation Chart
The statistical analysis conducted on geographies consisting of 253,602,231 people shows a slight positive correlation between the proportion of Costa Ricans and labor force participation rate among population between the ages 20 and 64 in the United States with a correlation coefficient (R) of 0.052 and weighted average of 79.7%. Similarly, the statistical analysis conducted on geographies consisting of 416,355,366 people shows a moderate positive correlation between the proportion of Immigrants from Korea and labor force participation rate among population between the ages 20 and 64 in the United States with a correlation coefficient (R) of 0.457 and weighted average of 80.3%, a difference of 0.68%.
In Labor Force | Age 20-64 Correlation Summary
| Measurement | Costa Rican | Immigrants from Korea |
| Minimum | 51.6% | 68.9% |
| Maximum | 92.8% | 100.0% |
| Range | 41.2% | 31.1% |
| Mean | 78.7% | 82.0% |
| Median | 79.9% | 80.6% |
| Interquartile 25% (IQ1) | 74.9% | 79.9% |
| Interquartile 75% (IQ3) | 83.5% | 83.1% |
| Interquartile Range (IQR) | 8.6% | 3.2% |
| Standard Deviation (Sample) | 8.6% | 5.6% |
| Standard Deviation (Population) | 8.5% | 5.6% |
Similar Demographics by In Labor Force | Age 20-64
Demographics Similar to Costa Ricans by In Labor Force | Age 20-64
In terms of in labor force | age 20-64, the demographic groups most similar to Costa Ricans are Scandinavian (79.7%, a difference of 0.0%), Immigrants from Northern Europe (79.7%, a difference of 0.0%), Icelander (79.7%, a difference of 0.030%), Immigrants from Kazakhstan (79.7%, a difference of 0.030%), and New Zealander (79.7%, a difference of 0.030%).
| Demographics | Rating | Rank | In Labor Force | Age 20-64 |
| Immigrants | Sweden | 79.7 /100 | #143 | Good 79.8% |
| Koreans | 79.6 /100 | #144 | Good 79.8% |
| Pakistanis | 79.3 /100 | #145 | Good 79.8% |
| Immigrants | Southern Europe | 78.9 /100 | #146 | Good 79.8% |
| Immigrants | Philippines | 78.0 /100 | #147 | Good 79.8% |
| Romanians | 77.6 /100 | #148 | Good 79.8% |
| Icelanders | 75.1 /100 | #149 | Good 79.7% |
| Costa Ricans | 72.4 /100 | #150 | Good 79.7% |
| Scandinavians | 72.0 /100 | #151 | Good 79.7% |
| Immigrants | Northern Europe | 72.0 /100 | #152 | Good 79.7% |
| Immigrants | Kazakhstan | 69.5 /100 | #153 | Good 79.7% |
| New Zealanders | 69.4 /100 | #154 | Good 79.7% |
| Immigrants | South Africa | 69.2 /100 | #155 | Good 79.7% |
| Senegalese | 69.1 /100 | #156 | Good 79.7% |
| Immigrants | China | 69.1 /100 | #157 | Good 79.7% |
Demographics Similar to Immigrants from Korea by In Labor Force | Age 20-64
In terms of in labor force | age 20-64, the demographic groups most similar to Immigrants from Korea are Immigrants from Albania (80.3%, a difference of 0.0%), Tongan (80.3%, a difference of 0.010%), Burmese (80.3%, a difference of 0.010%), Carpatho Rusyn (80.3%, a difference of 0.010%), and Lithuanian (80.2%, a difference of 0.010%).
| Demographics | Rating | Rank | In Labor Force | Age 20-64 |
| Immigrants | Northern Africa | 99.0 /100 | #56 | Exceptional 80.3% |
| Afghans | 98.9 /100 | #57 | Exceptional 80.3% |
| Serbians | 98.9 /100 | #58 | Exceptional 80.3% |
| Swedes | 98.9 /100 | #59 | Exceptional 80.3% |
| Tongans | 98.8 /100 | #60 | Exceptional 80.3% |
| Burmese | 98.8 /100 | #61 | Exceptional 80.3% |
| Carpatho Rusyns | 98.8 /100 | #62 | Exceptional 80.3% |
| Immigrants | Korea | 98.8 /100 | #63 | Exceptional 80.3% |
| Immigrants | Albania | 98.7 /100 | #64 | Exceptional 80.3% |
| Lithuanians | 98.7 /100 | #65 | Exceptional 80.2% |
| Macedonians | 98.7 /100 | #66 | Exceptional 80.2% |
| Taiwanese | 98.6 /100 | #67 | Exceptional 80.2% |
| Bhutanese | 98.6 /100 | #68 | Exceptional 80.2% |
| Albanians | 98.6 /100 | #69 | Exceptional 80.2% |
| Immigrants | Turkey | 98.5 /100 | #70 | Exceptional 80.2% |