Czechoslovakian vs Syrian In Labor Force | Age 20-64
COMPARE
Czechoslovakian
Syrian
In Labor Force | Age 20-64
In Labor Force | Age 20-64 Comparison
Czechoslovakians
Syrians
79.5%
IN LABOR FORCE | AGE 20-64
44.3/ 100
METRIC RATING
178th/ 347
METRIC RANK
79.6%
IN LABOR FORCE | AGE 20-64
50.0/ 100
METRIC RATING
174th/ 347
METRIC RANK
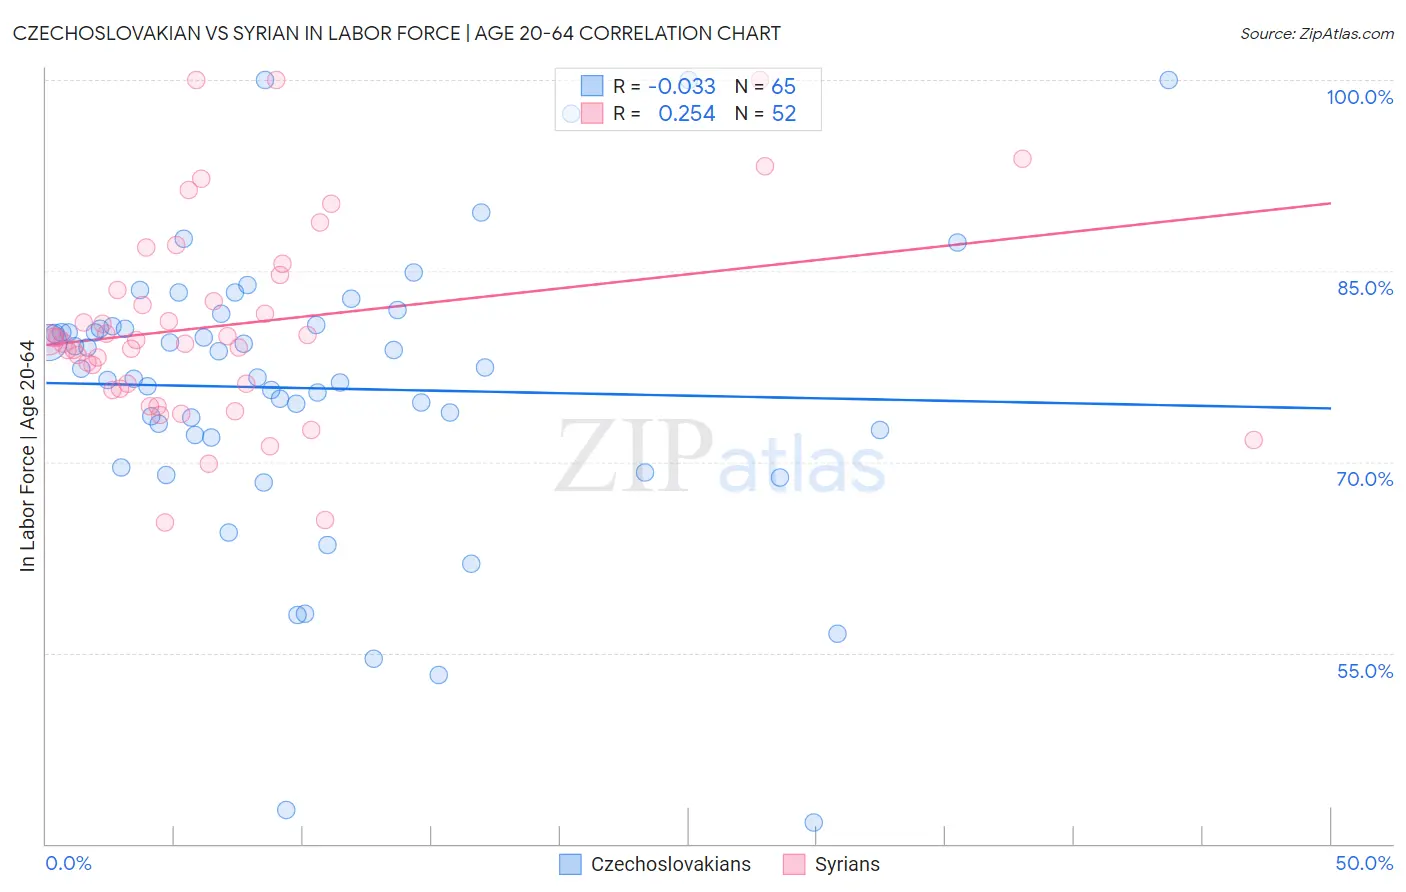
Czechoslovakian vs Syrian In Labor Force | Age 20-64 Correlation Chart
The statistical analysis conducted on geographies consisting of 368,672,704 people shows no correlation between the proportion of Czechoslovakians and labor force participation rate among population between the ages 20 and 64 in the United States with a correlation coefficient (R) of -0.033 and weighted average of 79.5%. Similarly, the statistical analysis conducted on geographies consisting of 266,330,303 people shows a weak positive correlation between the proportion of Syrians and labor force participation rate among population between the ages 20 and 64 in the United States with a correlation coefficient (R) of 0.254 and weighted average of 79.6%, a difference of 0.050%.
In Labor Force | Age 20-64 Correlation Summary
| Measurement | Czechoslovakian | Syrian |
| Minimum | 41.7% | 65.2% |
| Maximum | 100.0% | 100.0% |
| Range | 58.3% | 34.8% |
| Mean | 75.8% | 80.8% |
| Median | 77.3% | 79.6% |
| Interquartile 25% (IQ1) | 72.0% | 75.9% |
| Interquartile 75% (IQ3) | 80.7% | 84.1% |
| Interquartile Range (IQR) | 8.7% | 8.2% |
| Standard Deviation (Sample) | 11.4% | 7.9% |
| Standard Deviation (Population) | 11.3% | 7.8% |
Demographics Similar to Czechoslovakians and Syrians by In Labor Force | Age 20-64
In terms of in labor force | age 20-64, the demographic groups most similar to Czechoslovakians are Cuban (79.5%, a difference of 0.010%), Australian (79.5%, a difference of 0.010%), Immigrants from Netherlands (79.5%, a difference of 0.010%), Armenian (79.5%, a difference of 0.020%), and Salvadoran (79.5%, a difference of 0.030%). Similarly, the demographic groups most similar to Syrians are Immigrants from Scotland (79.6%, a difference of 0.020%), Slavic (79.6%, a difference of 0.030%), Immigrants from Switzerland (79.6%, a difference of 0.030%), Immigrants from Belgium (79.6%, a difference of 0.030%), and Cuban (79.5%, a difference of 0.030%).
| Demographics | Rating | Rank | In Labor Force | Age 20-64 |
| Okinawans | 62.7 /100 | #166 | Good 79.6% |
| Immigrants | Iraq | 62.0 /100 | #167 | Good 79.6% |
| Immigrants | Indonesia | 61.8 /100 | #168 | Good 79.6% |
| Laotians | 58.4 /100 | #169 | Average 79.6% |
| Slavs | 54.0 /100 | #170 | Average 79.6% |
| Immigrants | Switzerland | 53.3 /100 | #171 | Average 79.6% |
| Immigrants | Belgium | 53.1 /100 | #172 | Average 79.6% |
| Immigrants | Scotland | 52.4 /100 | #173 | Average 79.6% |
| Syrians | 50.0 /100 | #174 | Average 79.6% |
| Cubans | 46.1 /100 | #175 | Average 79.5% |
| Australians | 46.0 /100 | #176 | Average 79.5% |
| Immigrants | Netherlands | 45.2 /100 | #177 | Average 79.5% |
| Czechoslovakians | 44.3 /100 | #178 | Average 79.5% |
| Armenians | 41.4 /100 | #179 | Average 79.5% |
| Salvadorans | 41.0 /100 | #180 | Average 79.5% |
| Immigrants | Saudi Arabia | 37.7 /100 | #181 | Fair 79.5% |
| Malaysians | 37.1 /100 | #182 | Fair 79.5% |
| Immigrants | Hungary | 36.8 /100 | #183 | Fair 79.5% |
| Finns | 35.9 /100 | #184 | Fair 79.5% |
| Israelis | 34.7 /100 | #185 | Fair 79.5% |
| Northern Europeans | 34.5 /100 | #186 | Fair 79.5% |