Costa Rican vs Kiowa In Labor Force | Age 20-64
COMPARE
Costa Rican
Kiowa
In Labor Force | Age 20-64
In Labor Force | Age 20-64 Comparison
Costa Ricans
Kiowa
79.7%
IN LABOR FORCE | AGE 20-64
72.4/ 100
METRIC RATING
150th/ 347
METRIC RANK
75.0%
IN LABOR FORCE | AGE 20-64
0.0/ 100
METRIC RATING
328th/ 347
METRIC RANK
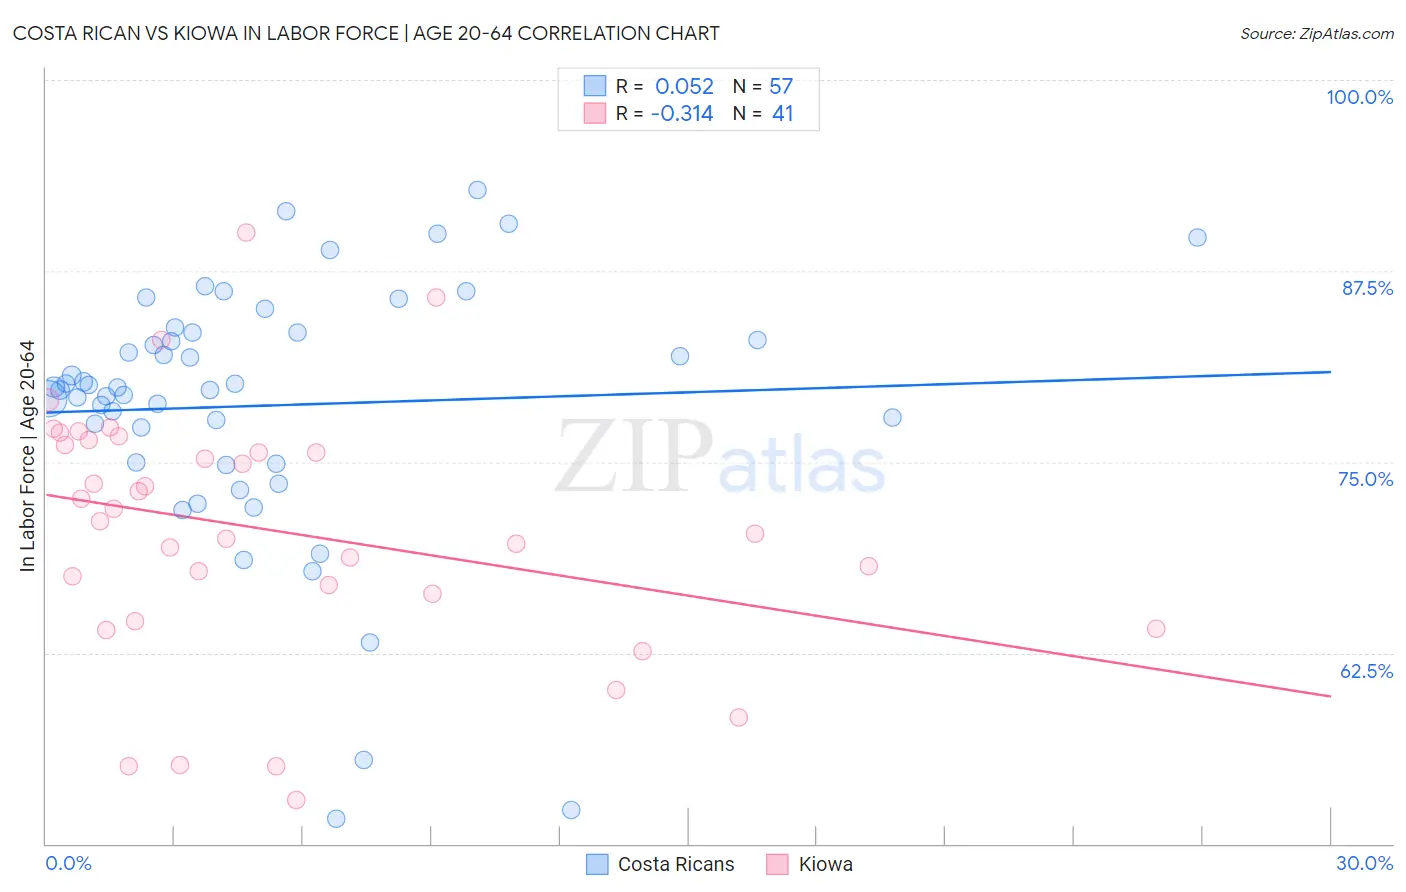
Costa Rican vs Kiowa In Labor Force | Age 20-64 Correlation Chart
The statistical analysis conducted on geographies consisting of 253,602,231 people shows a slight positive correlation between the proportion of Costa Ricans and labor force participation rate among population between the ages 20 and 64 in the United States with a correlation coefficient (R) of 0.052 and weighted average of 79.7%. Similarly, the statistical analysis conducted on geographies consisting of 56,099,396 people shows a mild negative correlation between the proportion of Kiowa and labor force participation rate among population between the ages 20 and 64 in the United States with a correlation coefficient (R) of -0.314 and weighted average of 75.0%, a difference of 6.3%.
In Labor Force | Age 20-64 Correlation Summary
| Measurement | Costa Rican | Kiowa |
| Minimum | 51.6% | 52.9% |
| Maximum | 92.8% | 90.0% |
| Range | 41.2% | 37.1% |
| Mean | 78.7% | 70.5% |
| Median | 79.9% | 71.1% |
| Interquartile 25% (IQ1) | 74.9% | 65.5% |
| Interquartile 75% (IQ3) | 83.5% | 76.3% |
| Interquartile Range (IQR) | 8.6% | 10.8% |
| Standard Deviation (Sample) | 8.6% | 8.3% |
| Standard Deviation (Population) | 8.5% | 8.2% |
Similar Demographics by In Labor Force | Age 20-64
Demographics Similar to Costa Ricans by In Labor Force | Age 20-64
In terms of in labor force | age 20-64, the demographic groups most similar to Costa Ricans are Scandinavian (79.7%, a difference of 0.0%), Immigrants from Northern Europe (79.7%, a difference of 0.0%), Icelander (79.7%, a difference of 0.030%), Immigrants from Kazakhstan (79.7%, a difference of 0.030%), and New Zealander (79.7%, a difference of 0.030%).
| Demographics | Rating | Rank | In Labor Force | Age 20-64 |
| Immigrants | Sweden | 79.7 /100 | #143 | Good 79.8% |
| Koreans | 79.6 /100 | #144 | Good 79.8% |
| Pakistanis | 79.3 /100 | #145 | Good 79.8% |
| Immigrants | Southern Europe | 78.9 /100 | #146 | Good 79.8% |
| Immigrants | Philippines | 78.0 /100 | #147 | Good 79.8% |
| Romanians | 77.6 /100 | #148 | Good 79.8% |
| Icelanders | 75.1 /100 | #149 | Good 79.7% |
| Costa Ricans | 72.4 /100 | #150 | Good 79.7% |
| Scandinavians | 72.0 /100 | #151 | Good 79.7% |
| Immigrants | Northern Europe | 72.0 /100 | #152 | Good 79.7% |
| Immigrants | Kazakhstan | 69.5 /100 | #153 | Good 79.7% |
| New Zealanders | 69.4 /100 | #154 | Good 79.7% |
| Immigrants | South Africa | 69.2 /100 | #155 | Good 79.7% |
| Senegalese | 69.1 /100 | #156 | Good 79.7% |
| Immigrants | China | 69.1 /100 | #157 | Good 79.7% |
Demographics Similar to Kiowa by In Labor Force | Age 20-64
In terms of in labor force | age 20-64, the demographic groups most similar to Kiowa are Sioux (75.0%, a difference of 0.030%), Creek (75.1%, a difference of 0.20%), Cheyenne (74.8%, a difference of 0.20%), Colville (74.8%, a difference of 0.26%), and Paiute (74.7%, a difference of 0.40%).
| Demographics | Rating | Rank | In Labor Force | Age 20-64 |
| Seminole | 0.0 /100 | #321 | Tragic 75.5% |
| Dutch West Indians | 0.0 /100 | #322 | Tragic 75.5% |
| Cajuns | 0.0 /100 | #323 | Tragic 75.5% |
| Choctaw | 0.0 /100 | #324 | Tragic 75.4% |
| Menominee | 0.0 /100 | #325 | Tragic 75.3% |
| Creek | 0.0 /100 | #326 | Tragic 75.1% |
| Sioux | 0.0 /100 | #327 | Tragic 75.0% |
| Kiowa | 0.0 /100 | #328 | Tragic 75.0% |
| Cheyenne | 0.0 /100 | #329 | Tragic 74.8% |
| Colville | 0.0 /100 | #330 | Tragic 74.8% |
| Paiute | 0.0 /100 | #331 | Tragic 74.7% |
| Arapaho | 0.0 /100 | #332 | Tragic 74.4% |
| Natives/Alaskans | 0.0 /100 | #333 | Tragic 73.9% |
| Apache | 0.0 /100 | #334 | Tragic 73.7% |
| Ute | 0.0 /100 | #335 | Tragic 73.7% |