Costa Rican vs Ukrainian In Labor Force | Age 20-64
COMPARE
Costa Rican
Ukrainian
In Labor Force | Age 20-64
In Labor Force | Age 20-64 Comparison
Costa Ricans
Ukrainians
79.7%
IN LABOR FORCE | AGE 20-64
72.4/ 100
METRIC RATING
150th/ 347
METRIC RANK
79.9%
IN LABOR FORCE | AGE 20-64
86.8/ 100
METRIC RATING
135th/ 347
METRIC RANK
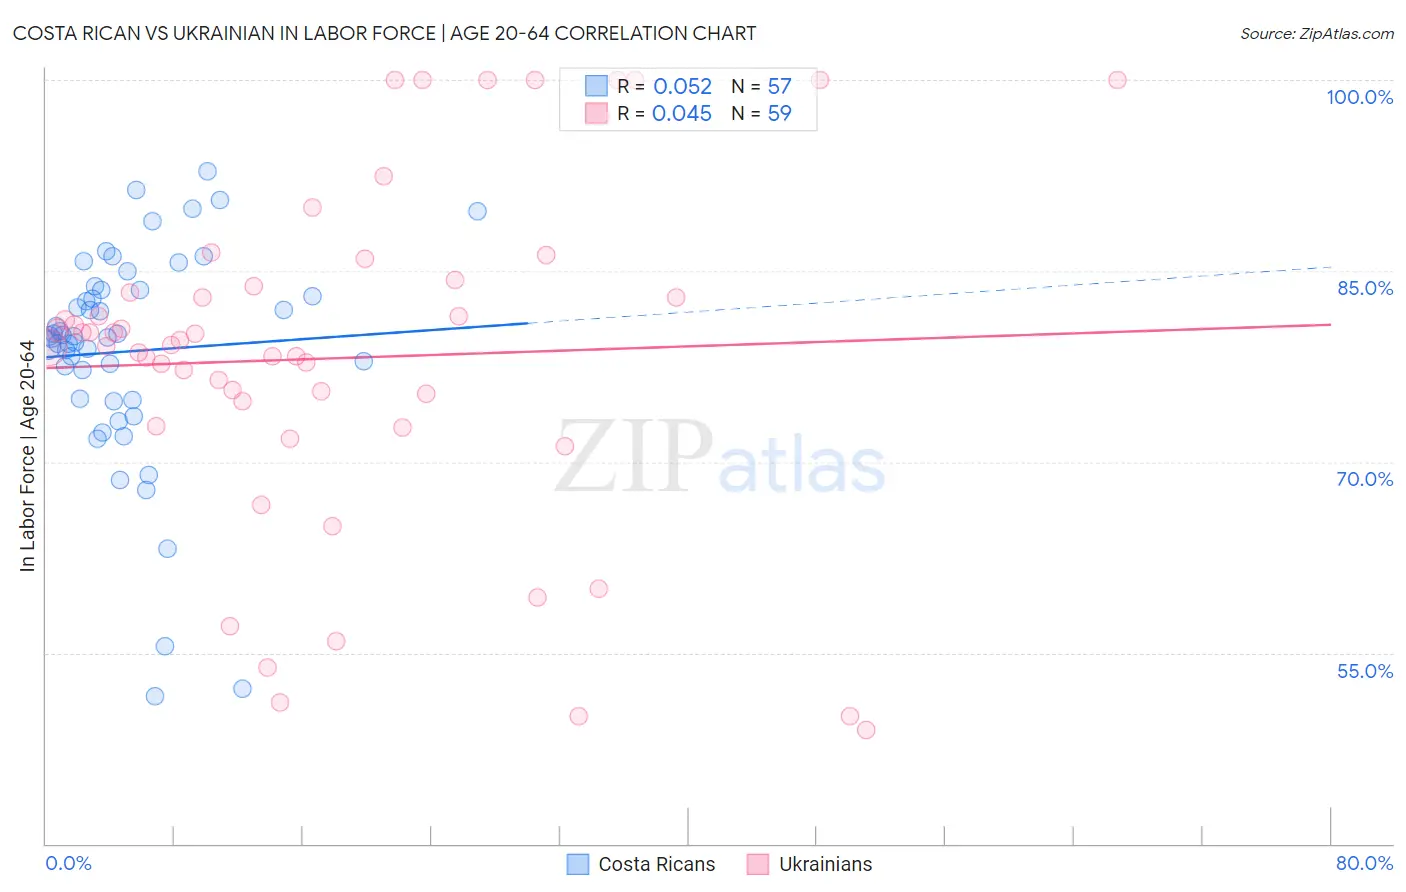
Costa Rican vs Ukrainian In Labor Force | Age 20-64 Correlation Chart
The statistical analysis conducted on geographies consisting of 253,602,231 people shows a slight positive correlation between the proportion of Costa Ricans and labor force participation rate among population between the ages 20 and 64 in the United States with a correlation coefficient (R) of 0.052 and weighted average of 79.7%. Similarly, the statistical analysis conducted on geographies consisting of 448,709,826 people shows no correlation between the proportion of Ukrainians and labor force participation rate among population between the ages 20 and 64 in the United States with a correlation coefficient (R) of 0.045 and weighted average of 79.9%, a difference of 0.18%.
In Labor Force | Age 20-64 Correlation Summary
| Measurement | Costa Rican | Ukrainian |
| Minimum | 51.6% | 48.9% |
| Maximum | 92.8% | 100.0% |
| Range | 41.2% | 51.1% |
| Mean | 78.7% | 78.2% |
| Median | 79.9% | 79.2% |
| Interquartile 25% (IQ1) | 74.9% | 72.8% |
| Interquartile 75% (IQ3) | 83.5% | 83.8% |
| Interquartile Range (IQR) | 8.6% | 11.0% |
| Standard Deviation (Sample) | 8.6% | 13.4% |
| Standard Deviation (Population) | 8.5% | 13.3% |
Demographics Similar to Costa Ricans and Ukrainians by In Labor Force | Age 20-64
In terms of in labor force | age 20-64, the demographic groups most similar to Costa Ricans are Scandinavian (79.7%, a difference of 0.0%), Immigrants from Northern Europe (79.7%, a difference of 0.0%), Icelander (79.7%, a difference of 0.030%), Immigrants from Philippines (79.8%, a difference of 0.060%), and Romanian (79.8%, a difference of 0.060%). Similarly, the demographic groups most similar to Ukrainians are Immigrants from Singapore (79.9%, a difference of 0.0%), South American Indian (79.9%, a difference of 0.010%), Belgian (79.9%, a difference of 0.010%), Immigrants from Ukraine (79.9%, a difference of 0.010%), and Immigrants from Nigeria (79.9%, a difference of 0.010%).
| Demographics | Rating | Rank | In Labor Force | Age 20-64 |
| Indians (Asian) | 87.7 /100 | #132 | Excellent 79.9% |
| South American Indians | 87.6 /100 | #133 | Excellent 79.9% |
| Belgians | 87.4 /100 | #134 | Excellent 79.9% |
| Ukrainians | 86.8 /100 | #135 | Excellent 79.9% |
| Immigrants | Singapore | 86.7 /100 | #136 | Excellent 79.9% |
| Immigrants | Ukraine | 86.5 /100 | #137 | Excellent 79.9% |
| Immigrants | Nigeria | 86.4 /100 | #138 | Excellent 79.9% |
| Immigrants | Spain | 83.9 /100 | #139 | Excellent 79.8% |
| Immigrants | South Eastern Asia | 80.4 /100 | #140 | Excellent 79.8% |
| Immigrants | Israel | 80.0 /100 | #141 | Good 79.8% |
| Slovaks | 79.9 /100 | #142 | Good 79.8% |
| Immigrants | Sweden | 79.7 /100 | #143 | Good 79.8% |
| Koreans | 79.6 /100 | #144 | Good 79.8% |
| Pakistanis | 79.3 /100 | #145 | Good 79.8% |
| Immigrants | Southern Europe | 78.9 /100 | #146 | Good 79.8% |
| Immigrants | Philippines | 78.0 /100 | #147 | Good 79.8% |
| Romanians | 77.6 /100 | #148 | Good 79.8% |
| Icelanders | 75.1 /100 | #149 | Good 79.7% |
| Costa Ricans | 72.4 /100 | #150 | Good 79.7% |
| Scandinavians | 72.0 /100 | #151 | Good 79.7% |
| Immigrants | Northern Europe | 72.0 /100 | #152 | Good 79.7% |