Tlingit-Haida vs Syrian In Labor Force | Age 20-64
COMPARE
Tlingit-Haida
Syrian
In Labor Force | Age 20-64
In Labor Force | Age 20-64 Comparison
Tlingit-Haida
Syrians
79.0%
IN LABOR FORCE | AGE 20-64
3.2/ 100
METRIC RATING
235th/ 347
METRIC RANK
79.6%
IN LABOR FORCE | AGE 20-64
50.0/ 100
METRIC RATING
174th/ 347
METRIC RANK
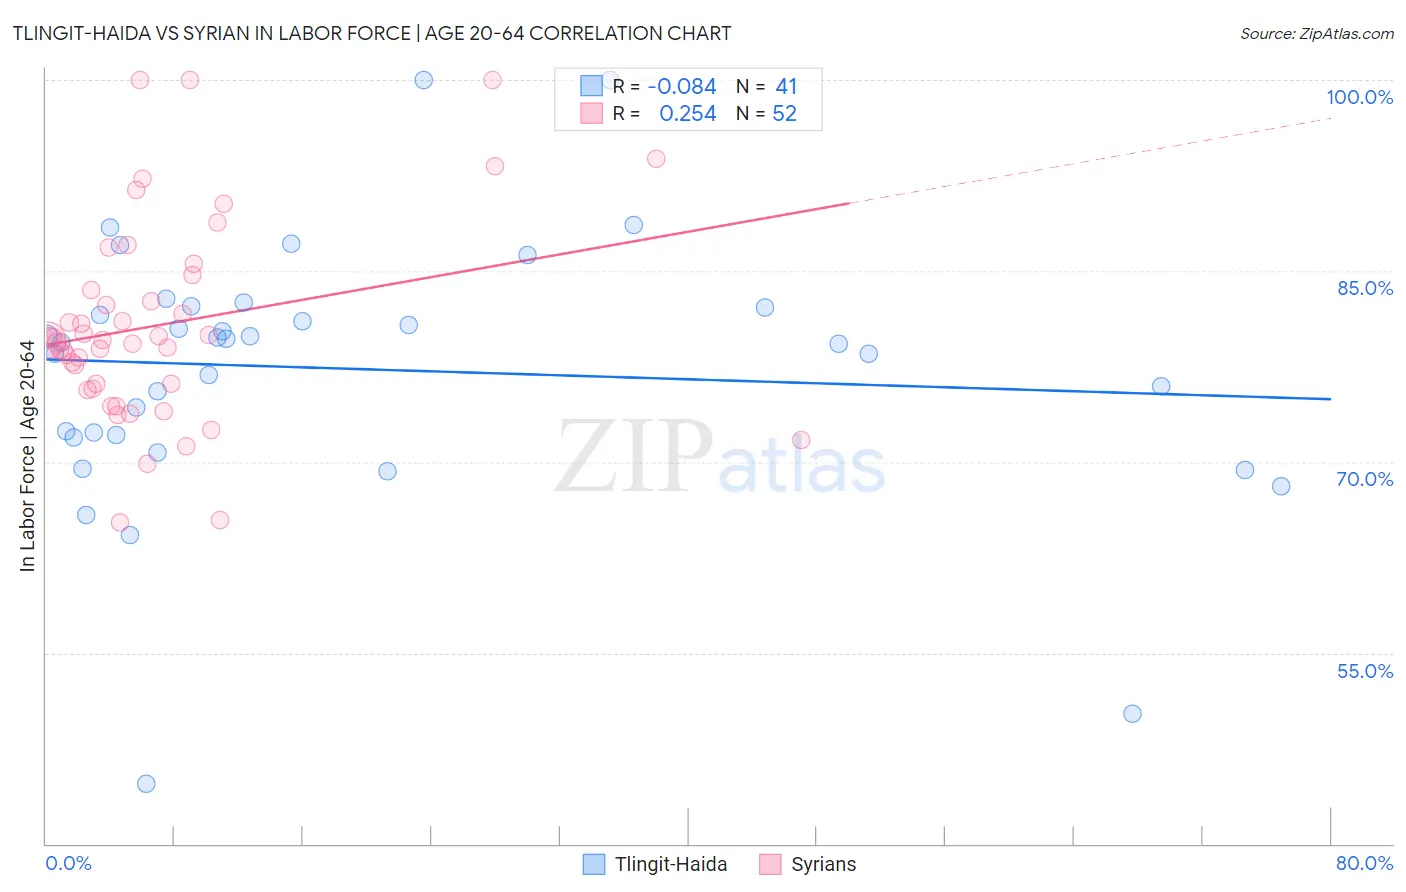
Tlingit-Haida vs Syrian In Labor Force | Age 20-64 Correlation Chart
The statistical analysis conducted on geographies consisting of 60,871,082 people shows a slight negative correlation between the proportion of Tlingit-Haida and labor force participation rate among population between the ages 20 and 64 in the United States with a correlation coefficient (R) of -0.084 and weighted average of 79.0%. Similarly, the statistical analysis conducted on geographies consisting of 266,330,303 people shows a weak positive correlation between the proportion of Syrians and labor force participation rate among population between the ages 20 and 64 in the United States with a correlation coefficient (R) of 0.254 and weighted average of 79.6%, a difference of 0.69%.
In Labor Force | Age 20-64 Correlation Summary
| Measurement | Tlingit-Haida | Syrian |
| Minimum | 44.7% | 65.2% |
| Maximum | 100.0% | 100.0% |
| Range | 55.3% | 34.8% |
| Mean | 77.3% | 80.8% |
| Median | 79.4% | 79.6% |
| Interquartile 25% (IQ1) | 72.0% | 75.9% |
| Interquartile 75% (IQ3) | 82.1% | 84.1% |
| Interquartile Range (IQR) | 10.1% | 8.2% |
| Standard Deviation (Sample) | 10.4% | 7.9% |
| Standard Deviation (Population) | 10.2% | 7.8% |
Similar Demographics by In Labor Force | Age 20-64
Demographics Similar to Tlingit-Haida by In Labor Force | Age 20-64
In terms of in labor force | age 20-64, the demographic groups most similar to Tlingit-Haida are Immigrants from Canada (79.0%, a difference of 0.0%), Samoan (79.0%, a difference of 0.020%), Immigrants from North America (79.0%, a difference of 0.020%), Immigrants from Jamaica (79.0%, a difference of 0.040%), and Japanese (79.1%, a difference of 0.050%).
| Demographics | Rating | Rank | In Labor Force | Age 20-64 |
| Panamanians | 5.7 /100 | #228 | Tragic 79.1% |
| Alsatians | 5.7 /100 | #229 | Tragic 79.1% |
| Native Hawaiians | 5.6 /100 | #230 | Tragic 79.1% |
| Lebanese | 5.1 /100 | #231 | Tragic 79.1% |
| Guamanians/Chamorros | 4.5 /100 | #232 | Tragic 79.1% |
| Japanese | 4.0 /100 | #233 | Tragic 79.1% |
| Immigrants | Canada | 3.2 /100 | #234 | Tragic 79.0% |
| Tlingit-Haida | 3.2 /100 | #235 | Tragic 79.0% |
| Samoans | 2.9 /100 | #236 | Tragic 79.0% |
| Immigrants | North America | 2.9 /100 | #237 | Tragic 79.0% |
| Immigrants | Jamaica | 2.6 /100 | #238 | Tragic 79.0% |
| Welsh | 2.4 /100 | #239 | Tragic 79.0% |
| Trinidadians and Tobagonians | 2.3 /100 | #240 | Tragic 79.0% |
| Jamaicans | 2.0 /100 | #241 | Tragic 78.9% |
| Immigrants | Micronesia | 1.9 /100 | #242 | Tragic 78.9% |
Demographics Similar to Syrians by In Labor Force | Age 20-64
In terms of in labor force | age 20-64, the demographic groups most similar to Syrians are Immigrants from Scotland (79.6%, a difference of 0.020%), Slavic (79.6%, a difference of 0.030%), Immigrants from Switzerland (79.6%, a difference of 0.030%), Immigrants from Belgium (79.6%, a difference of 0.030%), and Cuban (79.5%, a difference of 0.030%).
| Demographics | Rating | Rank | In Labor Force | Age 20-64 |
| Immigrants | Iraq | 62.0 /100 | #167 | Good 79.6% |
| Immigrants | Indonesia | 61.8 /100 | #168 | Good 79.6% |
| Laotians | 58.4 /100 | #169 | Average 79.6% |
| Slavs | 54.0 /100 | #170 | Average 79.6% |
| Immigrants | Switzerland | 53.3 /100 | #171 | Average 79.6% |
| Immigrants | Belgium | 53.1 /100 | #172 | Average 79.6% |
| Immigrants | Scotland | 52.4 /100 | #173 | Average 79.6% |
| Syrians | 50.0 /100 | #174 | Average 79.6% |
| Cubans | 46.1 /100 | #175 | Average 79.5% |
| Australians | 46.0 /100 | #176 | Average 79.5% |
| Immigrants | Netherlands | 45.2 /100 | #177 | Average 79.5% |
| Czechoslovakians | 44.3 /100 | #178 | Average 79.5% |
| Armenians | 41.4 /100 | #179 | Average 79.5% |
| Salvadorans | 41.0 /100 | #180 | Average 79.5% |
| Immigrants | Saudi Arabia | 37.7 /100 | #181 | Fair 79.5% |