Costa Rican vs Pima In Labor Force | Age > 16
COMPARE
Costa Rican
Pima
In Labor Force | Age > 16
In Labor Force | Age > 16 Comparison
Costa Ricans
Pima
65.6%
IN LABOR FORCE | AGE > 16
93.2/ 100
METRIC RATING
134th/ 347
METRIC RANK
57.4%
IN LABOR FORCE | AGE > 16
0.0/ 100
METRIC RATING
344th/ 347
METRIC RANK
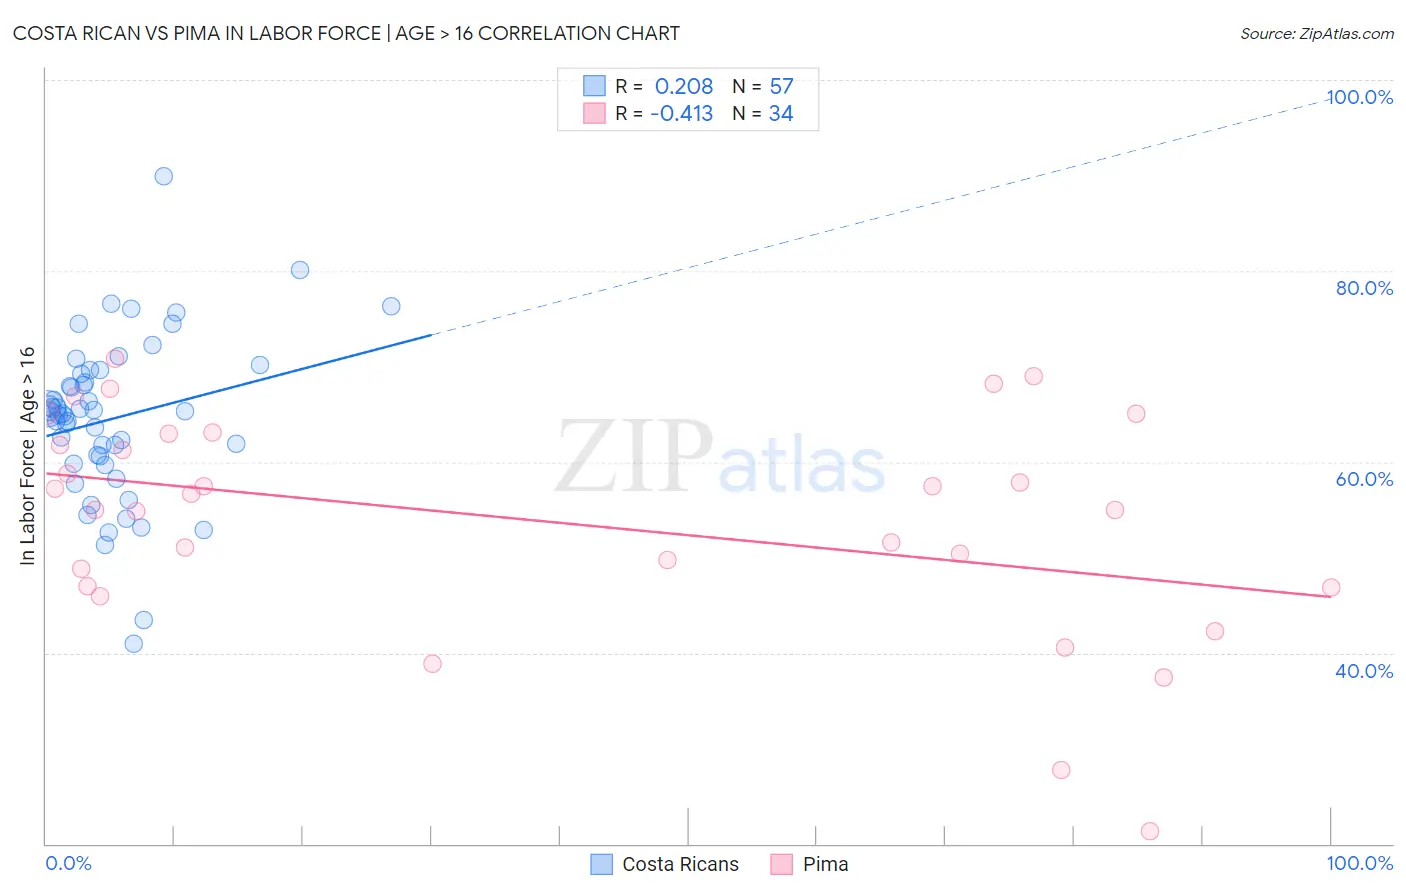
Costa Rican vs Pima In Labor Force | Age > 16 Correlation Chart
The statistical analysis conducted on geographies consisting of 253,602,231 people shows a weak positive correlation between the proportion of Costa Ricans and labor force participation rate among population ages 16 and over in the United States with a correlation coefficient (R) of 0.208 and weighted average of 65.6%. Similarly, the statistical analysis conducted on geographies consisting of 61,542,645 people shows a moderate negative correlation between the proportion of Pima and labor force participation rate among population ages 16 and over in the United States with a correlation coefficient (R) of -0.413 and weighted average of 57.4%, a difference of 14.3%.
In Labor Force | Age > 16 Correlation Summary
| Measurement | Costa Rican | Pima |
| Minimum | 40.9% | 21.3% |
| Maximum | 89.9% | 70.8% |
| Range | 49.0% | 49.5% |
| Mean | 64.5% | 53.8% |
| Median | 65.3% | 55.8% |
| Interquartile 25% (IQ1) | 60.2% | 46.9% |
| Interquartile 75% (IQ3) | 69.4% | 62.9% |
| Interquartile Range (IQR) | 9.2% | 16.0% |
| Standard Deviation (Sample) | 8.5% | 11.6% |
| Standard Deviation (Population) | 8.5% | 11.5% |
Similar Demographics by In Labor Force | Age > 16
Demographics Similar to Costa Ricans by In Labor Force | Age > 16
In terms of in labor force | age > 16, the demographic groups most similar to Costa Ricans are Immigrants from Lithuania (65.6%, a difference of 0.010%), Guatemalan (65.6%, a difference of 0.030%), Immigrants from Argentina (65.6%, a difference of 0.030%), Immigrants from North Macedonia (65.6%, a difference of 0.040%), and Guamanian/Chamorro (65.6%, a difference of 0.040%).
| Demographics | Rating | Rank | In Labor Force | Age > 16 |
| Immigrants | Eastern Asia | 94.9 /100 | #127 | Exceptional 65.7% |
| Ecuadorians | 94.7 /100 | #128 | Exceptional 65.6% |
| Immigrants | Philippines | 94.5 /100 | #129 | Exceptional 65.6% |
| Immigrants | Guatemala | 94.4 /100 | #130 | Exceptional 65.6% |
| Icelanders | 94.3 /100 | #131 | Exceptional 65.6% |
| Immigrants | North Macedonia | 94.1 /100 | #132 | Exceptional 65.6% |
| Immigrants | Lithuania | 93.5 /100 | #133 | Exceptional 65.6% |
| Costa Ricans | 93.2 /100 | #134 | Exceptional 65.6% |
| Guatemalans | 92.5 /100 | #135 | Exceptional 65.6% |
| Immigrants | Argentina | 92.4 /100 | #136 | Exceptional 65.6% |
| Guamanians/Chamorros | 92.4 /100 | #137 | Exceptional 65.6% |
| Immigrants | West Indies | 92.0 /100 | #138 | Exceptional 65.6% |
| Immigrants | Taiwan | 90.8 /100 | #139 | Exceptional 65.5% |
| Immigrants | Costa Rica | 90.8 /100 | #140 | Exceptional 65.5% |
| Samoans | 90.5 /100 | #141 | Exceptional 65.5% |
Demographics Similar to Pima by In Labor Force | Age > 16
In terms of in labor force | age > 16, the demographic groups most similar to Pima are Tohono O'odham (57.2%, a difference of 0.29%), Yuman (57.8%, a difference of 0.70%), Lumbee (56.8%, a difference of 1.1%), Puerto Rican (58.1%, a difference of 1.2%), and Navajo (56.6%, a difference of 1.5%).
| Demographics | Rating | Rank | In Labor Force | Age > 16 |
| Paiute | 0.0 /100 | #333 | Tragic 60.7% |
| Apache | 0.0 /100 | #334 | Tragic 60.7% |
| Natives/Alaskans | 0.0 /100 | #335 | Tragic 60.6% |
| Menominee | 0.0 /100 | #336 | Tragic 60.6% |
| Colville | 0.0 /100 | #337 | Tragic 59.8% |
| Immigrants | Yemen | 0.0 /100 | #338 | Tragic 59.6% |
| Houma | 0.0 /100 | #339 | Tragic 59.5% |
| Pueblo | 0.0 /100 | #340 | Tragic 59.3% |
| Hopi | 0.0 /100 | #341 | Tragic 58.4% |
| Puerto Ricans | 0.0 /100 | #342 | Tragic 58.1% |
| Yuman | 0.0 /100 | #343 | Tragic 57.8% |
| Pima | 0.0 /100 | #344 | Tragic 57.4% |
| Tohono O'odham | 0.0 /100 | #345 | Tragic 57.2% |
| Lumbee | 0.0 /100 | #346 | Tragic 56.8% |
| Navajo | 0.0 /100 | #347 | Tragic 56.6% |