Costa Rican vs Israeli In Labor Force | Age > 16
COMPARE
Costa Rican
Israeli
In Labor Force | Age > 16
In Labor Force | Age > 16 Comparison
Costa Ricans
Israelis
65.6%
IN LABOR FORCE | AGE > 16
93.2/ 100
METRIC RATING
134th/ 347
METRIC RANK
65.2%
IN LABOR FORCE | AGE > 16
61.6/ 100
METRIC RATING
171st/ 347
METRIC RANK
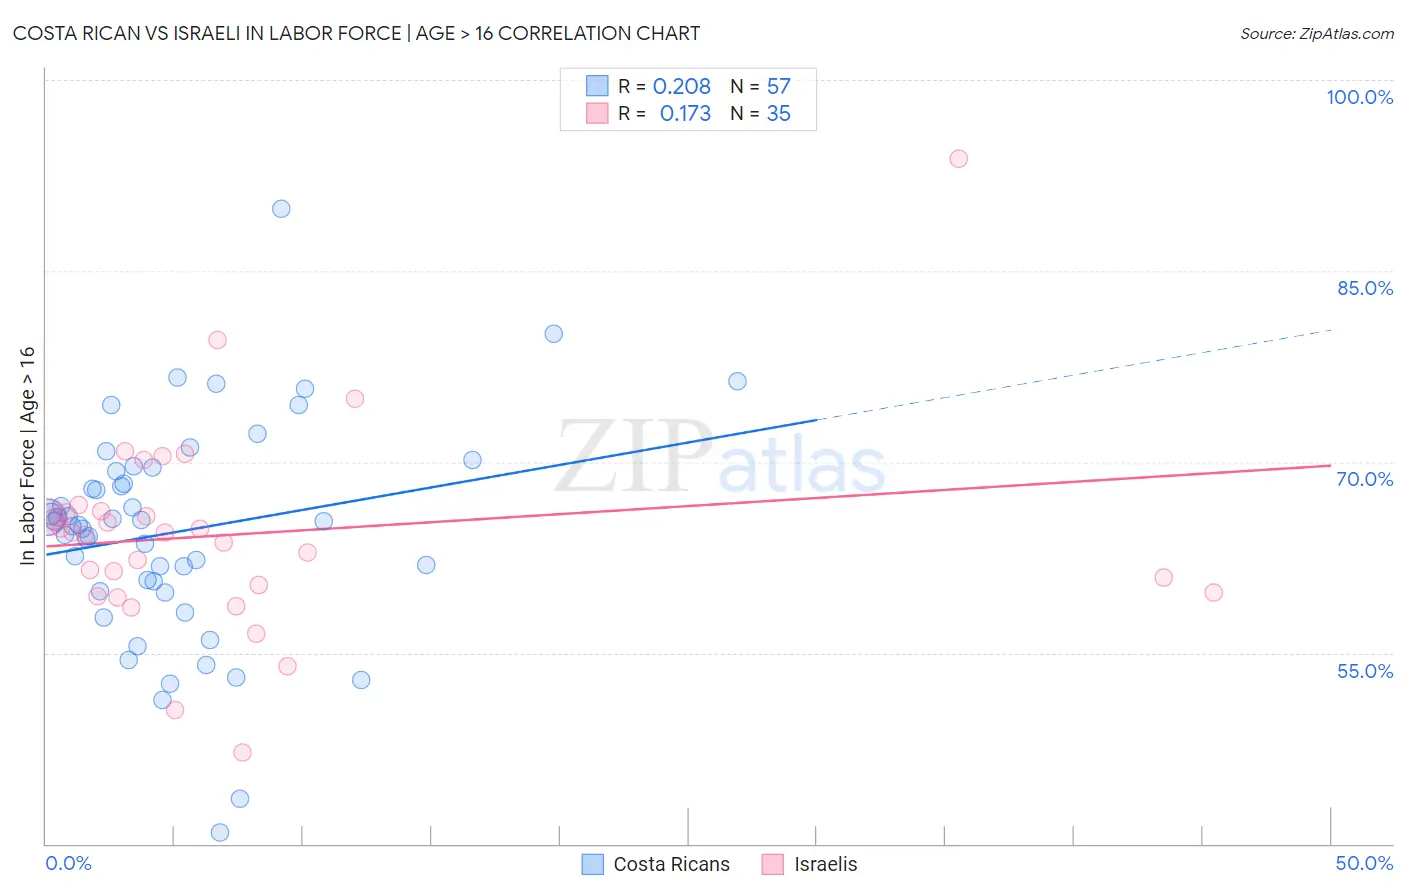
Costa Rican vs Israeli In Labor Force | Age > 16 Correlation Chart
The statistical analysis conducted on geographies consisting of 253,602,231 people shows a weak positive correlation between the proportion of Costa Ricans and labor force participation rate among population ages 16 and over in the United States with a correlation coefficient (R) of 0.208 and weighted average of 65.6%. Similarly, the statistical analysis conducted on geographies consisting of 211,218,768 people shows a poor positive correlation between the proportion of Israelis and labor force participation rate among population ages 16 and over in the United States with a correlation coefficient (R) of 0.173 and weighted average of 65.2%, a difference of 0.60%.
In Labor Force | Age > 16 Correlation Summary
| Measurement | Costa Rican | Israeli |
| Minimum | 40.9% | 47.2% |
| Maximum | 89.9% | 93.8% |
| Range | 49.0% | 46.6% |
| Mean | 64.5% | 64.3% |
| Median | 65.3% | 64.4% |
| Interquartile 25% (IQ1) | 60.2% | 59.7% |
| Interquartile 75% (IQ3) | 69.4% | 66.1% |
| Interquartile Range (IQR) | 9.2% | 6.4% |
| Standard Deviation (Sample) | 8.5% | 8.1% |
| Standard Deviation (Population) | 8.5% | 8.0% |
Similar Demographics by In Labor Force | Age > 16
Demographics Similar to Costa Ricans by In Labor Force | Age > 16
In terms of in labor force | age > 16, the demographic groups most similar to Costa Ricans are Immigrants from Lithuania (65.6%, a difference of 0.010%), Guatemalan (65.6%, a difference of 0.030%), Immigrants from Argentina (65.6%, a difference of 0.030%), Immigrants from North Macedonia (65.6%, a difference of 0.040%), and Guamanian/Chamorro (65.6%, a difference of 0.040%).
| Demographics | Rating | Rank | In Labor Force | Age > 16 |
| Immigrants | Eastern Asia | 94.9 /100 | #127 | Exceptional 65.7% |
| Ecuadorians | 94.7 /100 | #128 | Exceptional 65.6% |
| Immigrants | Philippines | 94.5 /100 | #129 | Exceptional 65.6% |
| Immigrants | Guatemala | 94.4 /100 | #130 | Exceptional 65.6% |
| Icelanders | 94.3 /100 | #131 | Exceptional 65.6% |
| Immigrants | North Macedonia | 94.1 /100 | #132 | Exceptional 65.6% |
| Immigrants | Lithuania | 93.5 /100 | #133 | Exceptional 65.6% |
| Costa Ricans | 93.2 /100 | #134 | Exceptional 65.6% |
| Guatemalans | 92.5 /100 | #135 | Exceptional 65.6% |
| Immigrants | Argentina | 92.4 /100 | #136 | Exceptional 65.6% |
| Guamanians/Chamorros | 92.4 /100 | #137 | Exceptional 65.6% |
| Immigrants | West Indies | 92.0 /100 | #138 | Exceptional 65.6% |
| Immigrants | Taiwan | 90.8 /100 | #139 | Exceptional 65.5% |
| Immigrants | Costa Rica | 90.8 /100 | #140 | Exceptional 65.5% |
| Samoans | 90.5 /100 | #141 | Exceptional 65.5% |
Demographics Similar to Israelis by In Labor Force | Age > 16
In terms of in labor force | age > 16, the demographic groups most similar to Israelis are Immigrants from Israel (65.2%, a difference of 0.0%), Immigrants from Sweden (65.2%, a difference of 0.0%), Arab (65.2%, a difference of 0.010%), Serbian (65.2%, a difference of 0.020%), and Immigrants from Belarus (65.2%, a difference of 0.050%).
| Demographics | Rating | Rank | In Labor Force | Age > 16 |
| Danes | 68.8 /100 | #164 | Good 65.3% |
| Immigrants | Kazakhstan | 68.1 /100 | #165 | Good 65.3% |
| Immigrants | Western Asia | 67.3 /100 | #166 | Good 65.3% |
| Immigrants | Belarus | 66.0 /100 | #167 | Good 65.2% |
| Serbians | 63.5 /100 | #168 | Good 65.2% |
| Arabs | 62.4 /100 | #169 | Good 65.2% |
| Immigrants | Israel | 61.7 /100 | #170 | Good 65.2% |
| Israelis | 61.6 /100 | #171 | Good 65.2% |
| Immigrants | Sweden | 61.3 /100 | #172 | Good 65.2% |
| Immigrants | Ukraine | 53.7 /100 | #173 | Average 65.1% |
| Macedonians | 50.0 /100 | #174 | Average 65.1% |
| Nicaraguans | 49.7 /100 | #175 | Average 65.1% |
| Swedes | 47.4 /100 | #176 | Average 65.1% |
| Eastern Europeans | 46.2 /100 | #177 | Average 65.1% |
| Trinidadians and Tobagonians | 45.2 /100 | #178 | Average 65.1% |