Costa Rican vs Cherokee In Labor Force | Age > 16
COMPARE
Costa Rican
Cherokee
In Labor Force | Age > 16
In Labor Force | Age > 16 Comparison
Costa Ricans
Cherokee
65.6%
IN LABOR FORCE | AGE > 16
93.2/ 100
METRIC RATING
134th/ 347
METRIC RANK
61.9%
IN LABOR FORCE | AGE > 16
0.0/ 100
METRIC RATING
325th/ 347
METRIC RANK
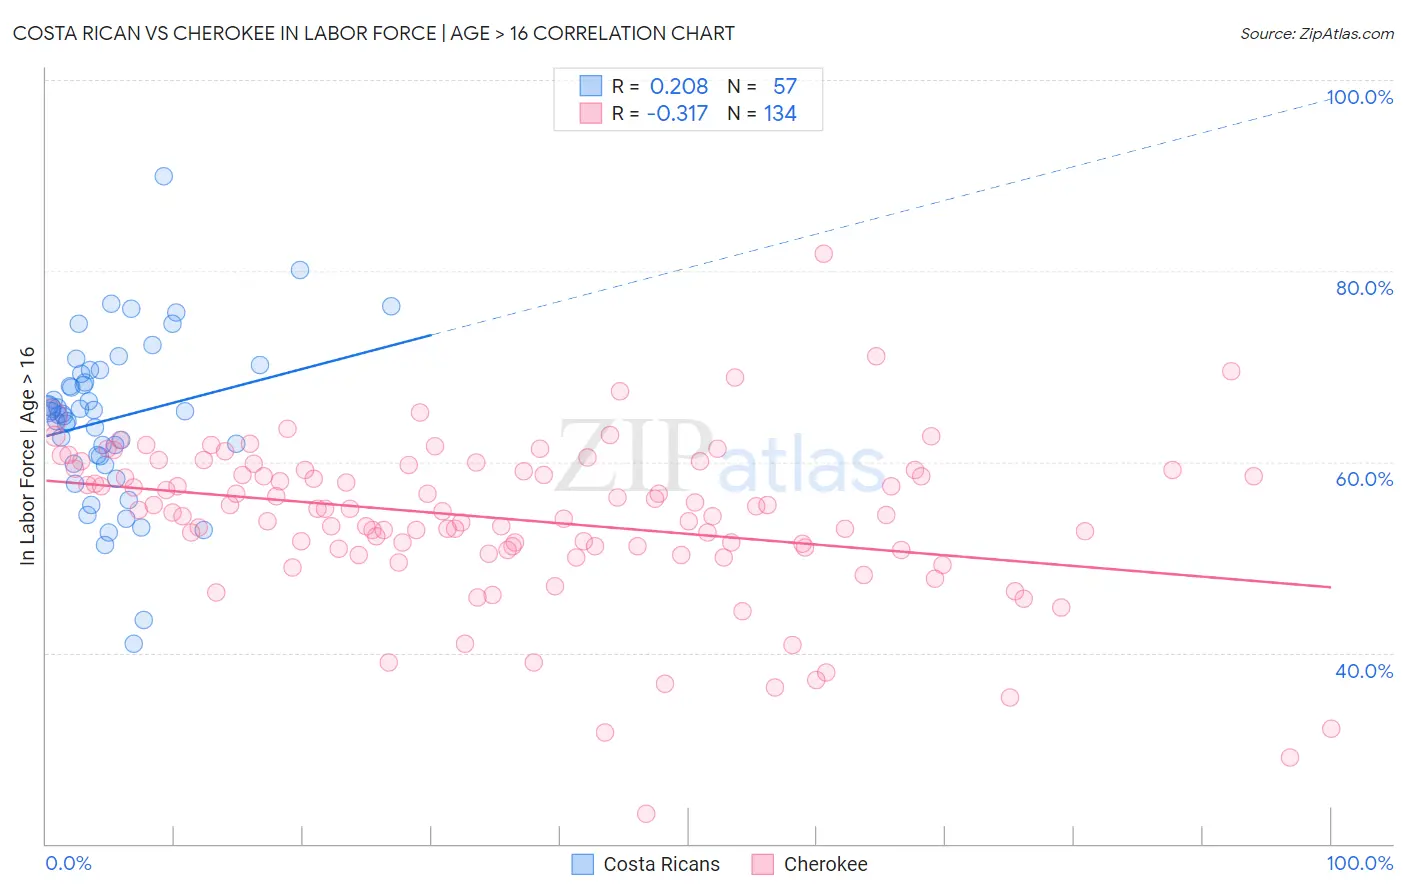
Costa Rican vs Cherokee In Labor Force | Age > 16 Correlation Chart
The statistical analysis conducted on geographies consisting of 253,602,231 people shows a weak positive correlation between the proportion of Costa Ricans and labor force participation rate among population ages 16 and over in the United States with a correlation coefficient (R) of 0.208 and weighted average of 65.6%. Similarly, the statistical analysis conducted on geographies consisting of 493,683,213 people shows a mild negative correlation between the proportion of Cherokee and labor force participation rate among population ages 16 and over in the United States with a correlation coefficient (R) of -0.317 and weighted average of 61.9%, a difference of 5.9%.
In Labor Force | Age > 16 Correlation Summary
| Measurement | Costa Rican | Cherokee |
| Minimum | 40.9% | 23.1% |
| Maximum | 89.9% | 81.8% |
| Range | 49.0% | 58.7% |
| Mean | 64.5% | 54.0% |
| Median | 65.3% | 54.9% |
| Interquartile 25% (IQ1) | 60.2% | 50.9% |
| Interquartile 75% (IQ3) | 69.4% | 59.1% |
| Interquartile Range (IQR) | 9.2% | 8.2% |
| Standard Deviation (Sample) | 8.5% | 8.4% |
| Standard Deviation (Population) | 8.5% | 8.4% |
Similar Demographics by In Labor Force | Age > 16
Demographics Similar to Costa Ricans by In Labor Force | Age > 16
In terms of in labor force | age > 16, the demographic groups most similar to Costa Ricans are Immigrants from Lithuania (65.6%, a difference of 0.010%), Guatemalan (65.6%, a difference of 0.030%), Immigrants from Argentina (65.6%, a difference of 0.030%), Immigrants from North Macedonia (65.6%, a difference of 0.040%), and Guamanian/Chamorro (65.6%, a difference of 0.040%).
| Demographics | Rating | Rank | In Labor Force | Age > 16 |
| Immigrants | Eastern Asia | 94.9 /100 | #127 | Exceptional 65.7% |
| Ecuadorians | 94.7 /100 | #128 | Exceptional 65.6% |
| Immigrants | Philippines | 94.5 /100 | #129 | Exceptional 65.6% |
| Immigrants | Guatemala | 94.4 /100 | #130 | Exceptional 65.6% |
| Icelanders | 94.3 /100 | #131 | Exceptional 65.6% |
| Immigrants | North Macedonia | 94.1 /100 | #132 | Exceptional 65.6% |
| Immigrants | Lithuania | 93.5 /100 | #133 | Exceptional 65.6% |
| Costa Ricans | 93.2 /100 | #134 | Exceptional 65.6% |
| Guatemalans | 92.5 /100 | #135 | Exceptional 65.6% |
| Immigrants | Argentina | 92.4 /100 | #136 | Exceptional 65.6% |
| Guamanians/Chamorros | 92.4 /100 | #137 | Exceptional 65.6% |
| Immigrants | West Indies | 92.0 /100 | #138 | Exceptional 65.6% |
| Immigrants | Taiwan | 90.8 /100 | #139 | Exceptional 65.5% |
| Immigrants | Costa Rica | 90.8 /100 | #140 | Exceptional 65.5% |
| Samoans | 90.5 /100 | #141 | Exceptional 65.5% |
Demographics Similar to Cherokee by In Labor Force | Age > 16
In terms of in labor force | age > 16, the demographic groups most similar to Cherokee are Cheyenne (62.0%, a difference of 0.050%), Seminole (62.0%, a difference of 0.090%), Ottawa (62.0%, a difference of 0.11%), Sioux (61.8%, a difference of 0.17%), and American (62.1%, a difference of 0.27%).
| Demographics | Rating | Rank | In Labor Force | Age > 16 |
| Chickasaw | 0.0 /100 | #318 | Tragic 62.3% |
| Arapaho | 0.0 /100 | #319 | Tragic 62.1% |
| Yakama | 0.0 /100 | #320 | Tragic 62.1% |
| Americans | 0.0 /100 | #321 | Tragic 62.1% |
| Ottawa | 0.0 /100 | #322 | Tragic 62.0% |
| Seminole | 0.0 /100 | #323 | Tragic 62.0% |
| Cheyenne | 0.0 /100 | #324 | Tragic 62.0% |
| Cherokee | 0.0 /100 | #325 | Tragic 61.9% |
| Sioux | 0.0 /100 | #326 | Tragic 61.8% |
| Cajuns | 0.0 /100 | #327 | Tragic 61.8% |
| Dutch West Indians | 0.0 /100 | #328 | Tragic 61.7% |
| Choctaw | 0.0 /100 | #329 | Tragic 61.5% |
| Creek | 0.0 /100 | #330 | Tragic 61.3% |
| Ute | 0.0 /100 | #331 | Tragic 60.9% |
| Crow | 0.0 /100 | #332 | Tragic 60.8% |