Comanche vs Native/Alaskan In Labor Force | Age 30-34
COMPARE
Comanche
Native/Alaskan
In Labor Force | Age 30-34
In Labor Force | Age 30-34 Comparison
Comanche
Natives/Alaskans
82.6%
IN LABOR FORCE | AGE 30-34
0.0/ 100
METRIC RATING
297th/ 347
METRIC RANK
79.2%
IN LABOR FORCE | AGE 30-34
0.0/ 100
METRIC RATING
336th/ 347
METRIC RANK
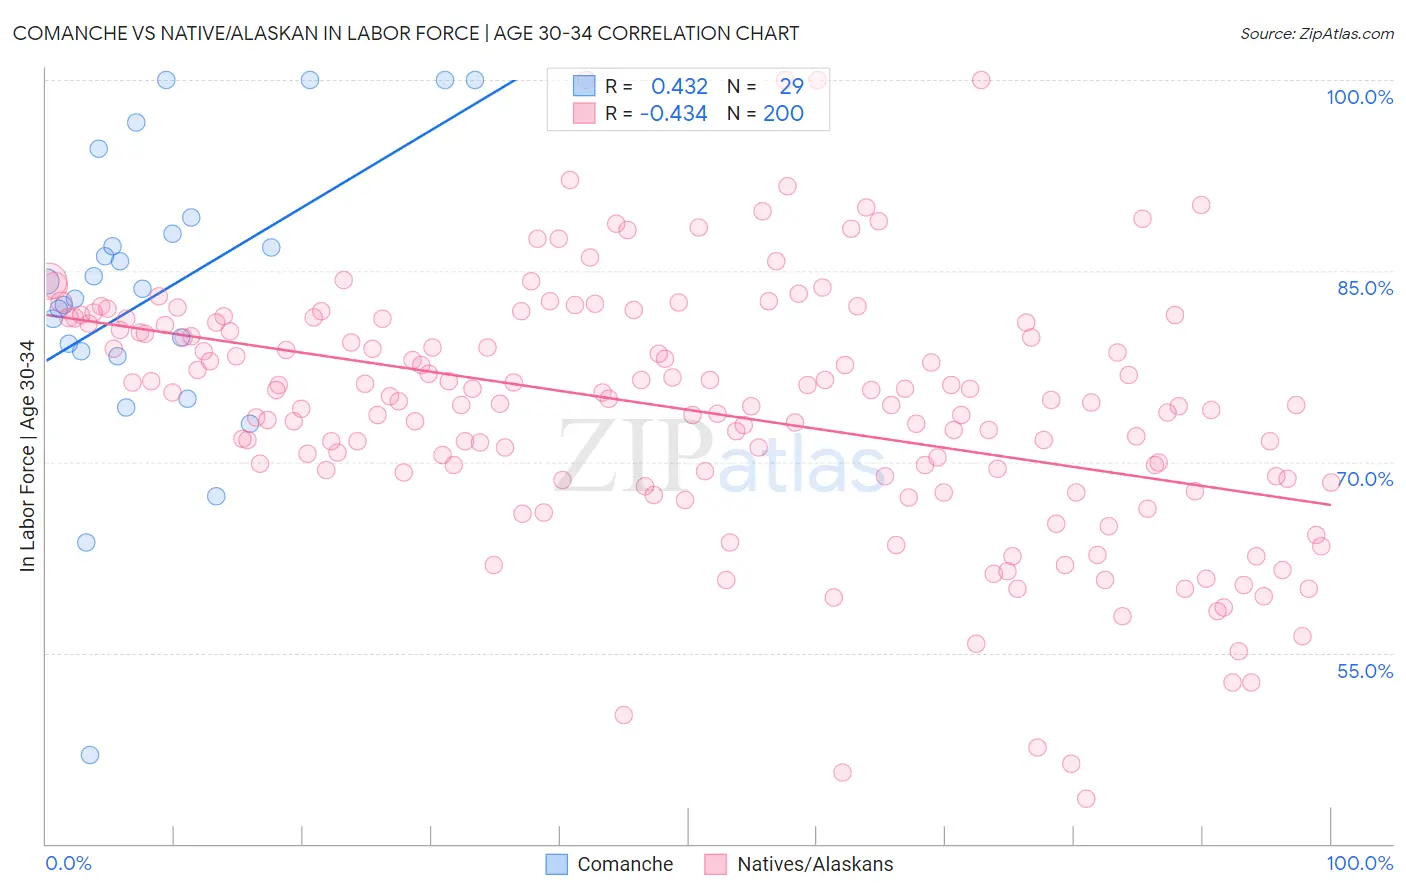
Comanche vs Native/Alaskan In Labor Force | Age 30-34 Correlation Chart
The statistical analysis conducted on geographies consisting of 109,766,840 people shows a moderate positive correlation between the proportion of Comanche and labor force participation rate among population between the ages 30 and 34 in the United States with a correlation coefficient (R) of 0.432 and weighted average of 82.6%. Similarly, the statistical analysis conducted on geographies consisting of 512,461,419 people shows a moderate negative correlation between the proportion of Natives/Alaskans and labor force participation rate among population between the ages 30 and 34 in the United States with a correlation coefficient (R) of -0.434 and weighted average of 79.2%, a difference of 4.3%.
In Labor Force | Age 30-34 Correlation Summary
| Measurement | Comanche | Native/Alaskan |
| Minimum | 46.9% | 43.5% |
| Maximum | 100.0% | 100.0% |
| Range | 53.1% | 56.5% |
| Mean | 83.1% | 74.1% |
| Median | 83.6% | 74.8% |
| Interquartile 25% (IQ1) | 78.5% | 68.9% |
| Interquartile 75% (IQ3) | 88.5% | 80.9% |
| Interquartile Range (IQR) | 10.0% | 12.0% |
| Standard Deviation (Sample) | 11.7% | 10.0% |
| Standard Deviation (Population) | 11.5% | 10.0% |
Similar Demographics by In Labor Force | Age 30-34
Demographics Similar to Comanche by In Labor Force | Age 30-34
In terms of in labor force | age 30-34, the demographic groups most similar to Comanche are Aleut (82.6%, a difference of 0.0%), Chippewa (82.6%, a difference of 0.010%), Pennsylvania German (82.6%, a difference of 0.030%), Immigrants from Central America (82.5%, a difference of 0.13%), and American (82.7%, a difference of 0.15%).
| Demographics | Rating | Rank | In Labor Force | Age 30-34 |
| Blackfeet | 0.0 /100 | #290 | Tragic 82.8% |
| Potawatomi | 0.0 /100 | #291 | Tragic 82.8% |
| Blacks/African Americans | 0.0 /100 | #292 | Tragic 82.8% |
| Nepalese | 0.0 /100 | #293 | Tragic 82.7% |
| Americans | 0.0 /100 | #294 | Tragic 82.7% |
| Pennsylvania Germans | 0.0 /100 | #295 | Tragic 82.6% |
| Chippewa | 0.0 /100 | #296 | Tragic 82.6% |
| Comanche | 0.0 /100 | #297 | Tragic 82.6% |
| Aleuts | 0.0 /100 | #298 | Tragic 82.6% |
| Immigrants | Central America | 0.0 /100 | #299 | Tragic 82.5% |
| Hmong | 0.0 /100 | #300 | Tragic 82.4% |
| Hispanics or Latinos | 0.0 /100 | #301 | Tragic 82.4% |
| Ottawa | 0.0 /100 | #302 | Tragic 82.4% |
| Immigrants | Micronesia | 0.0 /100 | #303 | Tragic 82.4% |
| Tlingit-Haida | 0.0 /100 | #304 | Tragic 82.3% |
Demographics Similar to Natives/Alaskans by In Labor Force | Age 30-34
In terms of in labor force | age 30-34, the demographic groups most similar to Natives/Alaskans are Yakama (79.1%, a difference of 0.040%), Marshallese (79.2%, a difference of 0.080%), Hopi (79.3%, a difference of 0.12%), Pima (79.0%, a difference of 0.16%), and Apache (79.0%, a difference of 0.19%).
| Demographics | Rating | Rank | In Labor Force | Age 30-34 |
| Creek | 0.0 /100 | #329 | Tragic 80.4% |
| Pueblo | 0.0 /100 | #330 | Tragic 80.0% |
| Houma | 0.0 /100 | #331 | Tragic 79.9% |
| Kiowa | 0.0 /100 | #332 | Tragic 79.8% |
| Inupiat | 0.0 /100 | #333 | Tragic 79.7% |
| Hopi | 0.0 /100 | #334 | Tragic 79.3% |
| Marshallese | 0.0 /100 | #335 | Tragic 79.2% |
| Natives/Alaskans | 0.0 /100 | #336 | Tragic 79.2% |
| Yakama | 0.0 /100 | #337 | Tragic 79.1% |
| Pima | 0.0 /100 | #338 | Tragic 79.0% |
| Apache | 0.0 /100 | #339 | Tragic 79.0% |
| Ute | 0.0 /100 | #340 | Tragic 78.9% |
| Immigrants | Yemen | 0.0 /100 | #341 | Tragic 78.2% |
| Tohono O'odham | 0.0 /100 | #342 | Tragic 77.7% |
| Lumbee | 0.0 /100 | #343 | Tragic 77.3% |