Comanche vs Romanian In Labor Force | Age 30-34
COMPARE
Comanche
Romanian
In Labor Force | Age 30-34
In Labor Force | Age 30-34 Comparison
Comanche
Romanians
82.6%
IN LABOR FORCE | AGE 30-34
0.0/ 100
METRIC RATING
297th/ 347
METRIC RANK
84.8%
IN LABOR FORCE | AGE 30-34
73.5/ 100
METRIC RATING
152nd/ 347
METRIC RANK
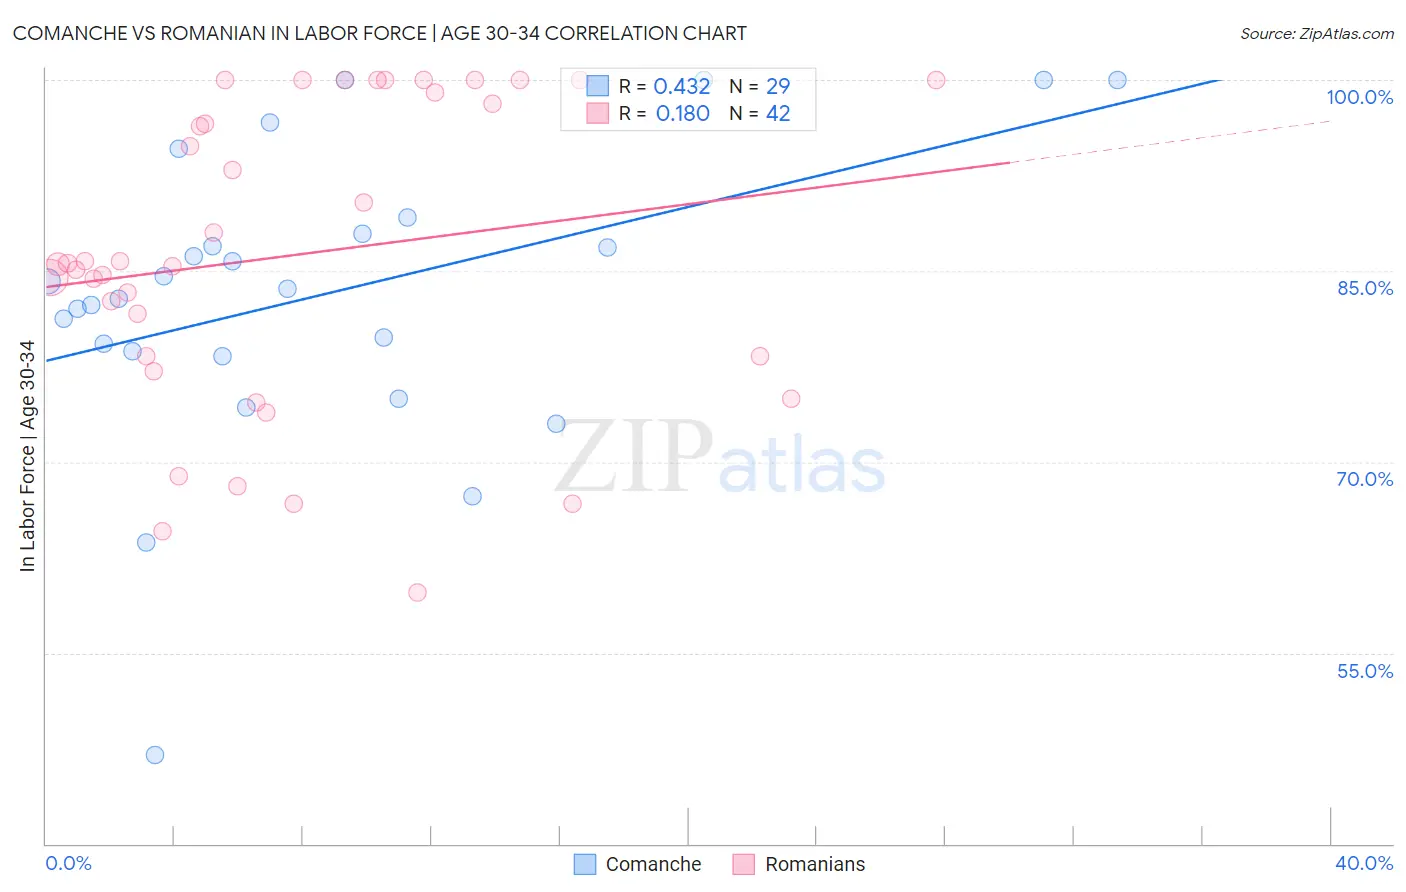
Comanche vs Romanian In Labor Force | Age 30-34 Correlation Chart
The statistical analysis conducted on geographies consisting of 109,766,840 people shows a moderate positive correlation between the proportion of Comanche and labor force participation rate among population between the ages 30 and 34 in the United States with a correlation coefficient (R) of 0.432 and weighted average of 82.6%. Similarly, the statistical analysis conducted on geographies consisting of 377,700,007 people shows a poor positive correlation between the proportion of Romanians and labor force participation rate among population between the ages 30 and 34 in the United States with a correlation coefficient (R) of 0.180 and weighted average of 84.8%, a difference of 2.7%.
In Labor Force | Age 30-34 Correlation Summary
| Measurement | Comanche | Romanian |
| Minimum | 46.9% | 59.7% |
| Maximum | 100.0% | 100.0% |
| Range | 53.1% | 40.3% |
| Mean | 83.1% | 86.2% |
| Median | 83.6% | 85.6% |
| Interquartile 25% (IQ1) | 78.5% | 78.3% |
| Interquartile 75% (IQ3) | 88.5% | 99.0% |
| Interquartile Range (IQR) | 10.0% | 20.7% |
| Standard Deviation (Sample) | 11.7% | 11.9% |
| Standard Deviation (Population) | 11.5% | 11.7% |
Similar Demographics by In Labor Force | Age 30-34
Demographics Similar to Comanche by In Labor Force | Age 30-34
In terms of in labor force | age 30-34, the demographic groups most similar to Comanche are Aleut (82.6%, a difference of 0.0%), Chippewa (82.6%, a difference of 0.010%), Pennsylvania German (82.6%, a difference of 0.030%), Immigrants from Central America (82.5%, a difference of 0.13%), and American (82.7%, a difference of 0.15%).
| Demographics | Rating | Rank | In Labor Force | Age 30-34 |
| Blackfeet | 0.0 /100 | #290 | Tragic 82.8% |
| Potawatomi | 0.0 /100 | #291 | Tragic 82.8% |
| Blacks/African Americans | 0.0 /100 | #292 | Tragic 82.8% |
| Nepalese | 0.0 /100 | #293 | Tragic 82.7% |
| Americans | 0.0 /100 | #294 | Tragic 82.7% |
| Pennsylvania Germans | 0.0 /100 | #295 | Tragic 82.6% |
| Chippewa | 0.0 /100 | #296 | Tragic 82.6% |
| Comanche | 0.0 /100 | #297 | Tragic 82.6% |
| Aleuts | 0.0 /100 | #298 | Tragic 82.6% |
| Immigrants | Central America | 0.0 /100 | #299 | Tragic 82.5% |
| Hmong | 0.0 /100 | #300 | Tragic 82.4% |
| Hispanics or Latinos | 0.0 /100 | #301 | Tragic 82.4% |
| Ottawa | 0.0 /100 | #302 | Tragic 82.4% |
| Immigrants | Micronesia | 0.0 /100 | #303 | Tragic 82.4% |
| Tlingit-Haida | 0.0 /100 | #304 | Tragic 82.3% |
Demographics Similar to Romanians by In Labor Force | Age 30-34
In terms of in labor force | age 30-34, the demographic groups most similar to Romanians are Immigrants from Senegal (84.8%, a difference of 0.0%), German (84.8%, a difference of 0.010%), Immigrants from Ukraine (84.8%, a difference of 0.020%), Immigrants from Saudi Arabia (84.9%, a difference of 0.030%), and Immigrants from Colombia (84.9%, a difference of 0.030%).
| Demographics | Rating | Rank | In Labor Force | Age 30-34 |
| Palestinians | 77.7 /100 | #145 | Good 84.9% |
| Immigrants | Saudi Arabia | 76.6 /100 | #146 | Good 84.9% |
| Immigrants | Colombia | 76.3 /100 | #147 | Good 84.9% |
| Immigrants | Pakistan | 76.2 /100 | #148 | Good 84.9% |
| Immigrants | Ukraine | 75.1 /100 | #149 | Good 84.8% |
| Germans | 75.1 /100 | #150 | Good 84.8% |
| Immigrants | Senegal | 74.0 /100 | #151 | Good 84.8% |
| Romanians | 73.5 /100 | #152 | Good 84.8% |
| Syrians | 70.1 /100 | #153 | Good 84.8% |
| Northern Europeans | 70.0 /100 | #154 | Good 84.8% |
| Immigrants | Sudan | 69.5 /100 | #155 | Good 84.8% |
| French Canadians | 67.3 /100 | #156 | Good 84.8% |
| Peruvians | 65.9 /100 | #157 | Good 84.8% |
| Immigrants | Armenia | 64.7 /100 | #158 | Good 84.8% |
| Czechoslovakians | 63.0 /100 | #159 | Good 84.8% |