Immigrants from Turkey vs Native/Alaskan In Labor Force | Age 30-34
COMPARE
Immigrants from Turkey
Native/Alaskan
In Labor Force | Age 30-34
In Labor Force | Age 30-34 Comparison
Immigrants from Turkey
Natives/Alaskans
85.5%
IN LABOR FORCE | AGE 30-34
99.6/ 100
METRIC RATING
55th/ 347
METRIC RANK
79.2%
IN LABOR FORCE | AGE 30-34
0.0/ 100
METRIC RATING
336th/ 347
METRIC RANK
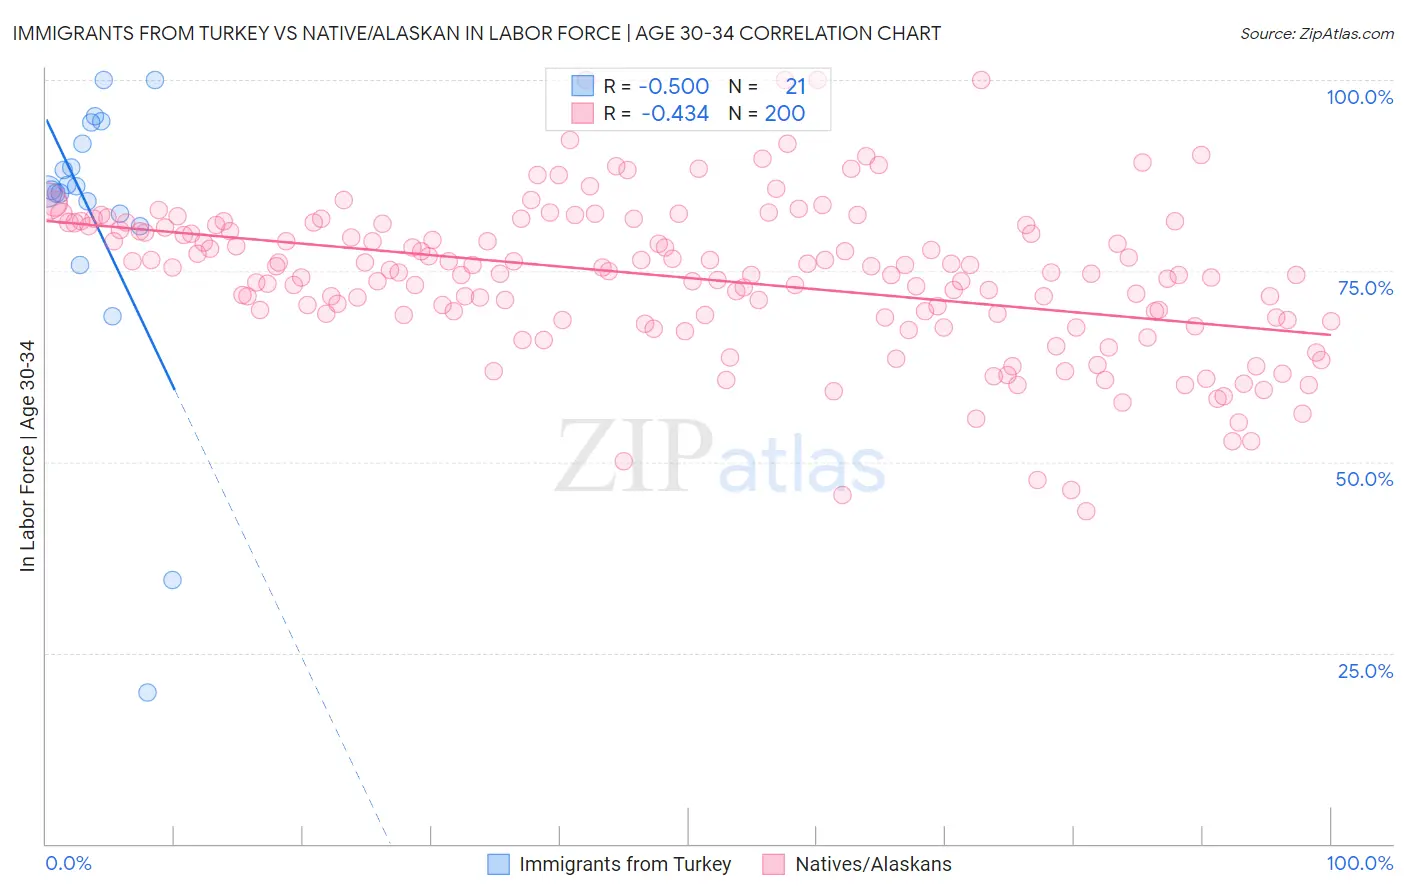
Immigrants from Turkey vs Native/Alaskan In Labor Force | Age 30-34 Correlation Chart
The statistical analysis conducted on geographies consisting of 222,992,305 people shows a moderate negative correlation between the proportion of Immigrants from Turkey and labor force participation rate among population between the ages 30 and 34 in the United States with a correlation coefficient (R) of -0.500 and weighted average of 85.5%. Similarly, the statistical analysis conducted on geographies consisting of 512,461,419 people shows a moderate negative correlation between the proportion of Natives/Alaskans and labor force participation rate among population between the ages 30 and 34 in the United States with a correlation coefficient (R) of -0.434 and weighted average of 79.2%, a difference of 8.0%.
In Labor Force | Age 30-34 Correlation Summary
| Measurement | Immigrants from Turkey | Native/Alaskan |
| Minimum | 19.8% | 43.5% |
| Maximum | 100.0% | 100.0% |
| Range | 80.2% | 56.5% |
| Mean | 81.6% | 74.1% |
| Median | 85.6% | 74.8% |
| Interquartile 25% (IQ1) | 81.7% | 68.9% |
| Interquartile 75% (IQ3) | 93.0% | 80.9% |
| Interquartile Range (IQR) | 11.3% | 12.0% |
| Standard Deviation (Sample) | 19.7% | 10.0% |
| Standard Deviation (Population) | 19.2% | 10.0% |
Similar Demographics by In Labor Force | Age 30-34
Demographics Similar to Immigrants from Turkey by In Labor Force | Age 30-34
In terms of in labor force | age 30-34, the demographic groups most similar to Immigrants from Turkey are Immigrants from Kenya (85.5%, a difference of 0.0%), Czech (85.5%, a difference of 0.010%), Russian (85.5%, a difference of 0.010%), Polish (85.5%, a difference of 0.010%), and Filipino (85.5%, a difference of 0.020%).
| Demographics | Rating | Rank | In Labor Force | Age 30-34 |
| Immigrants | Sweden | 99.8 /100 | #48 | Exceptional 85.6% |
| Lithuanians | 99.8 /100 | #49 | Exceptional 85.6% |
| Immigrants | Australia | 99.8 /100 | #50 | Exceptional 85.6% |
| Cape Verdeans | 99.7 /100 | #51 | Exceptional 85.6% |
| Slovenes | 99.7 /100 | #52 | Exceptional 85.6% |
| Filipinos | 99.6 /100 | #53 | Exceptional 85.5% |
| Immigrants | Kenya | 99.6 /100 | #54 | Exceptional 85.5% |
| Immigrants | Turkey | 99.6 /100 | #55 | Exceptional 85.5% |
| Czechs | 99.6 /100 | #56 | Exceptional 85.5% |
| Russians | 99.6 /100 | #57 | Exceptional 85.5% |
| Poles | 99.6 /100 | #58 | Exceptional 85.5% |
| Immigrants | Poland | 99.5 /100 | #59 | Exceptional 85.5% |
| Immigrants | France | 99.5 /100 | #60 | Exceptional 85.5% |
| Immigrants | Brazil | 99.5 /100 | #61 | Exceptional 85.5% |
| Soviet Union | 99.4 /100 | #62 | Exceptional 85.5% |
Demographics Similar to Natives/Alaskans by In Labor Force | Age 30-34
In terms of in labor force | age 30-34, the demographic groups most similar to Natives/Alaskans are Yakama (79.1%, a difference of 0.040%), Marshallese (79.2%, a difference of 0.080%), Hopi (79.3%, a difference of 0.12%), Pima (79.0%, a difference of 0.16%), and Apache (79.0%, a difference of 0.19%).
| Demographics | Rating | Rank | In Labor Force | Age 30-34 |
| Creek | 0.0 /100 | #329 | Tragic 80.4% |
| Pueblo | 0.0 /100 | #330 | Tragic 80.0% |
| Houma | 0.0 /100 | #331 | Tragic 79.9% |
| Kiowa | 0.0 /100 | #332 | Tragic 79.8% |
| Inupiat | 0.0 /100 | #333 | Tragic 79.7% |
| Hopi | 0.0 /100 | #334 | Tragic 79.3% |
| Marshallese | 0.0 /100 | #335 | Tragic 79.2% |
| Natives/Alaskans | 0.0 /100 | #336 | Tragic 79.2% |
| Yakama | 0.0 /100 | #337 | Tragic 79.1% |
| Pima | 0.0 /100 | #338 | Tragic 79.0% |
| Apache | 0.0 /100 | #339 | Tragic 79.0% |
| Ute | 0.0 /100 | #340 | Tragic 78.9% |
| Immigrants | Yemen | 0.0 /100 | #341 | Tragic 78.2% |
| Tohono O'odham | 0.0 /100 | #342 | Tragic 77.7% |
| Lumbee | 0.0 /100 | #343 | Tragic 77.3% |