Comanche vs Haitian In Labor Force | Age 30-34
COMPARE
Comanche
Haitian
In Labor Force | Age 30-34
In Labor Force | Age 30-34 Comparison
Comanche
Haitians
82.6%
IN LABOR FORCE | AGE 30-34
0.0/ 100
METRIC RATING
297th/ 347
METRIC RANK
84.1%
IN LABOR FORCE | AGE 30-34
1.8/ 100
METRIC RATING
234th/ 347
METRIC RANK
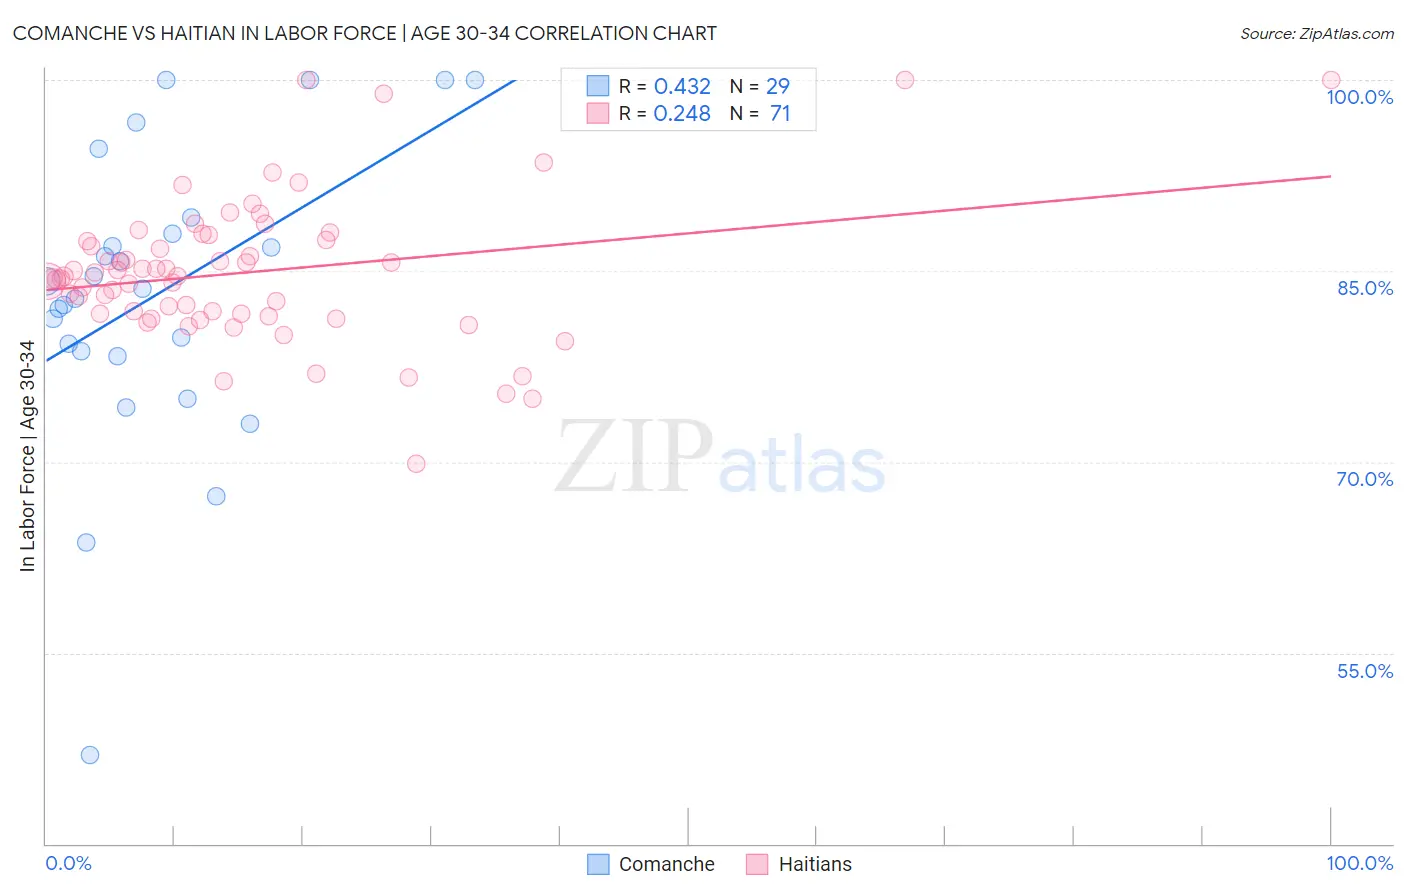
Comanche vs Haitian In Labor Force | Age 30-34 Correlation Chart
The statistical analysis conducted on geographies consisting of 109,766,840 people shows a moderate positive correlation between the proportion of Comanche and labor force participation rate among population between the ages 30 and 34 in the United States with a correlation coefficient (R) of 0.432 and weighted average of 82.6%. Similarly, the statistical analysis conducted on geographies consisting of 287,776,350 people shows a weak positive correlation between the proportion of Haitians and labor force participation rate among population between the ages 30 and 34 in the United States with a correlation coefficient (R) of 0.248 and weighted average of 84.1%, a difference of 1.8%.
In Labor Force | Age 30-34 Correlation Summary
| Measurement | Comanche | Haitian |
| Minimum | 46.9% | 69.8% |
| Maximum | 100.0% | 100.0% |
| Range | 53.1% | 30.2% |
| Mean | 83.1% | 84.9% |
| Median | 83.6% | 84.6% |
| Interquartile 25% (IQ1) | 78.5% | 81.6% |
| Interquartile 75% (IQ3) | 88.5% | 87.4% |
| Interquartile Range (IQR) | 10.0% | 5.8% |
| Standard Deviation (Sample) | 11.7% | 5.6% |
| Standard Deviation (Population) | 11.5% | 5.6% |
Similar Demographics by In Labor Force | Age 30-34
Demographics Similar to Comanche by In Labor Force | Age 30-34
In terms of in labor force | age 30-34, the demographic groups most similar to Comanche are Aleut (82.6%, a difference of 0.0%), Chippewa (82.6%, a difference of 0.010%), Pennsylvania German (82.6%, a difference of 0.030%), Immigrants from Central America (82.5%, a difference of 0.13%), and American (82.7%, a difference of 0.15%).
| Demographics | Rating | Rank | In Labor Force | Age 30-34 |
| Blackfeet | 0.0 /100 | #290 | Tragic 82.8% |
| Potawatomi | 0.0 /100 | #291 | Tragic 82.8% |
| Blacks/African Americans | 0.0 /100 | #292 | Tragic 82.8% |
| Nepalese | 0.0 /100 | #293 | Tragic 82.7% |
| Americans | 0.0 /100 | #294 | Tragic 82.7% |
| Pennsylvania Germans | 0.0 /100 | #295 | Tragic 82.6% |
| Chippewa | 0.0 /100 | #296 | Tragic 82.6% |
| Comanche | 0.0 /100 | #297 | Tragic 82.6% |
| Aleuts | 0.0 /100 | #298 | Tragic 82.6% |
| Immigrants | Central America | 0.0 /100 | #299 | Tragic 82.5% |
| Hmong | 0.0 /100 | #300 | Tragic 82.4% |
| Hispanics or Latinos | 0.0 /100 | #301 | Tragic 82.4% |
| Ottawa | 0.0 /100 | #302 | Tragic 82.4% |
| Immigrants | Micronesia | 0.0 /100 | #303 | Tragic 82.4% |
| Tlingit-Haida | 0.0 /100 | #304 | Tragic 82.3% |
Demographics Similar to Haitians by In Labor Force | Age 30-34
In terms of in labor force | age 30-34, the demographic groups most similar to Haitians are West Indian (84.1%, a difference of 0.010%), French American Indian (84.1%, a difference of 0.010%), Immigrants (84.1%, a difference of 0.020%), U.S. Virgin Islander (84.1%, a difference of 0.030%), and Malaysian (84.1%, a difference of 0.040%).
| Demographics | Rating | Rank | In Labor Force | Age 30-34 |
| Immigrants | Cuba | 3.0 /100 | #227 | Tragic 84.2% |
| Immigrants | Haiti | 2.8 /100 | #228 | Tragic 84.2% |
| Welsh | 2.7 /100 | #229 | Tragic 84.2% |
| Immigrants | Bahamas | 2.6 /100 | #230 | Tragic 84.1% |
| Malaysians | 2.2 /100 | #231 | Tragic 84.1% |
| Immigrants | Immigrants | 2.0 /100 | #232 | Tragic 84.1% |
| West Indians | 1.9 /100 | #233 | Tragic 84.1% |
| Haitians | 1.8 /100 | #234 | Tragic 84.1% |
| French American Indians | 1.7 /100 | #235 | Tragic 84.1% |
| U.S. Virgin Islanders | 1.5 /100 | #236 | Tragic 84.1% |
| Celtics | 1.4 /100 | #237 | Tragic 84.1% |
| Immigrants | Barbados | 1.4 /100 | #238 | Tragic 84.0% |
| English | 1.4 /100 | #239 | Tragic 84.0% |
| Venezuelans | 1.3 /100 | #240 | Tragic 84.0% |
| Immigrants | Portugal | 1.2 /100 | #241 | Tragic 84.0% |