Immigrants from Bulgaria vs Native/Alaskan In Labor Force | Age 30-34
COMPARE
Immigrants from Bulgaria
Native/Alaskan
In Labor Force | Age 30-34
In Labor Force | Age 30-34 Comparison
Immigrants from Bulgaria
Natives/Alaskans
86.0%
IN LABOR FORCE | AGE 30-34
100.0/ 100
METRIC RATING
21st/ 347
METRIC RANK
79.2%
IN LABOR FORCE | AGE 30-34
0.0/ 100
METRIC RATING
336th/ 347
METRIC RANK
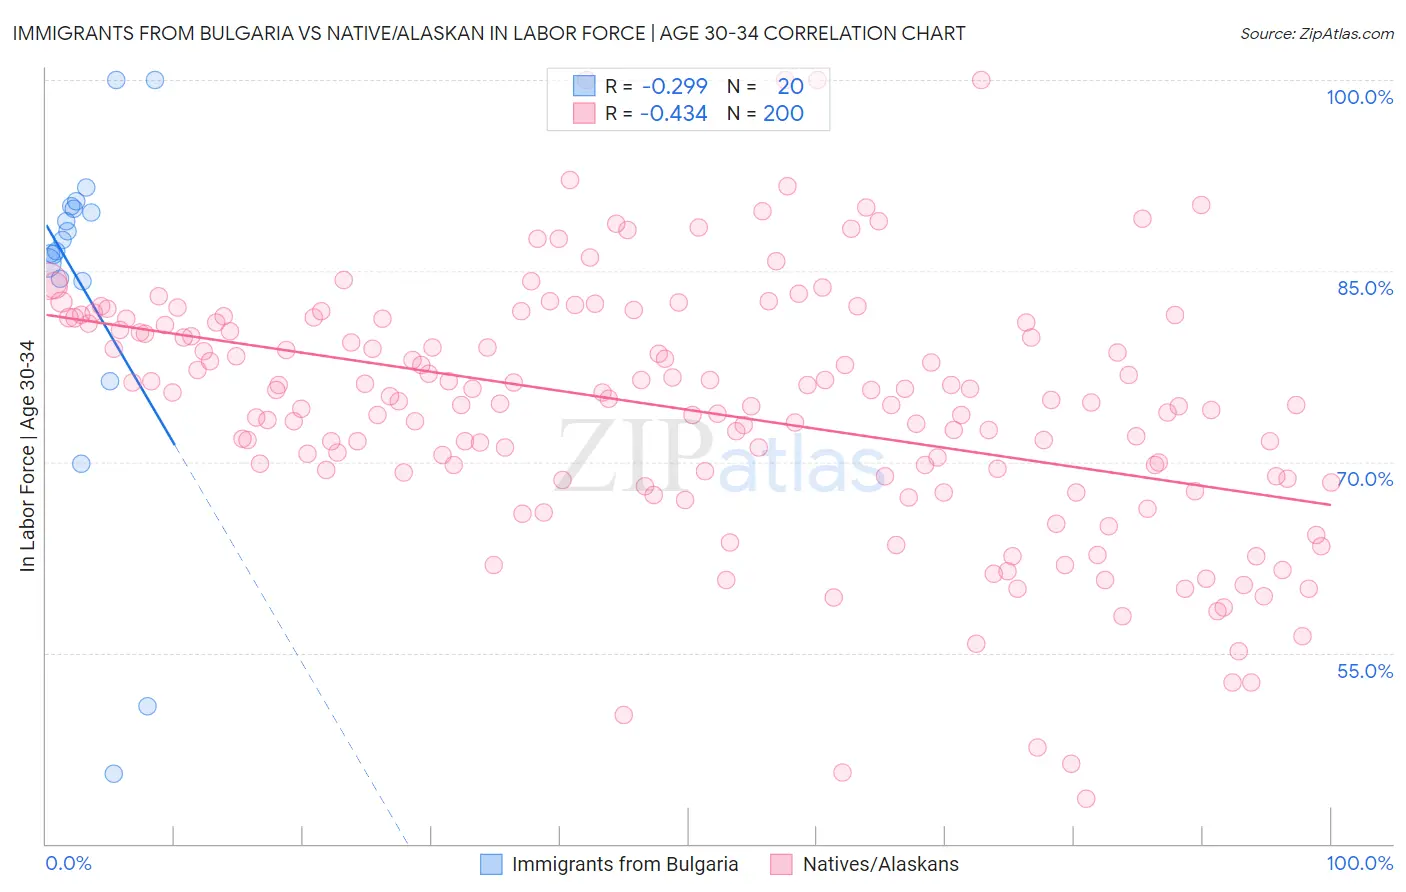
Immigrants from Bulgaria vs Native/Alaskan In Labor Force | Age 30-34 Correlation Chart
The statistical analysis conducted on geographies consisting of 172,547,682 people shows a weak negative correlation between the proportion of Immigrants from Bulgaria and labor force participation rate among population between the ages 30 and 34 in the United States with a correlation coefficient (R) of -0.299 and weighted average of 86.0%. Similarly, the statistical analysis conducted on geographies consisting of 512,461,419 people shows a moderate negative correlation between the proportion of Natives/Alaskans and labor force participation rate among population between the ages 30 and 34 in the United States with a correlation coefficient (R) of -0.434 and weighted average of 79.2%, a difference of 8.6%.
In Labor Force | Age 30-34 Correlation Summary
| Measurement | Immigrants from Bulgaria | Native/Alaskan |
| Minimum | 45.5% | 43.5% |
| Maximum | 100.0% | 100.0% |
| Range | 54.5% | 56.5% |
| Mean | 83.6% | 74.1% |
| Median | 87.0% | 74.8% |
| Interquartile 25% (IQ1) | 84.3% | 68.9% |
| Interquartile 75% (IQ3) | 90.0% | 80.9% |
| Interquartile Range (IQR) | 5.7% | 12.0% |
| Standard Deviation (Sample) | 13.8% | 10.0% |
| Standard Deviation (Population) | 13.5% | 10.0% |
Similar Demographics by In Labor Force | Age 30-34
Demographics Similar to Immigrants from Bulgaria by In Labor Force | Age 30-34
In terms of in labor force | age 30-34, the demographic groups most similar to Immigrants from Bulgaria are Bulgarian (86.0%, a difference of 0.0%), Sierra Leonean (86.0%, a difference of 0.010%), Bermudan (85.9%, a difference of 0.020%), Estonian (85.9%, a difference of 0.030%), and Immigrants from Eritrea (85.9%, a difference of 0.040%).
| Demographics | Rating | Rank | In Labor Force | Age 30-34 |
| Immigrants | Cabo Verde | 100.0 /100 | #14 | Exceptional 86.1% |
| Immigrants | Albania | 100.0 /100 | #15 | Exceptional 86.1% |
| Latvians | 100.0 /100 | #16 | Exceptional 86.0% |
| Immigrants | Cameroon | 100.0 /100 | #17 | Exceptional 86.0% |
| Immigrants | Sierra Leone | 100.0 /100 | #18 | Exceptional 86.0% |
| Sierra Leoneans | 100.0 /100 | #19 | Exceptional 86.0% |
| Bulgarians | 100.0 /100 | #20 | Exceptional 86.0% |
| Immigrants | Bulgaria | 100.0 /100 | #21 | Exceptional 86.0% |
| Bermudans | 100.0 /100 | #22 | Exceptional 85.9% |
| Estonians | 100.0 /100 | #23 | Exceptional 85.9% |
| Immigrants | Eritrea | 100.0 /100 | #24 | Exceptional 85.9% |
| Immigrants | North Macedonia | 100.0 /100 | #25 | Exceptional 85.9% |
| Immigrants | Eastern Africa | 100.0 /100 | #26 | Exceptional 85.9% |
| Immigrants | Liberia | 100.0 /100 | #27 | Exceptional 85.9% |
| Immigrants | Latvia | 100.0 /100 | #28 | Exceptional 85.9% |
Demographics Similar to Natives/Alaskans by In Labor Force | Age 30-34
In terms of in labor force | age 30-34, the demographic groups most similar to Natives/Alaskans are Yakama (79.1%, a difference of 0.040%), Marshallese (79.2%, a difference of 0.080%), Hopi (79.3%, a difference of 0.12%), Pima (79.0%, a difference of 0.16%), and Apache (79.0%, a difference of 0.19%).
| Demographics | Rating | Rank | In Labor Force | Age 30-34 |
| Creek | 0.0 /100 | #329 | Tragic 80.4% |
| Pueblo | 0.0 /100 | #330 | Tragic 80.0% |
| Houma | 0.0 /100 | #331 | Tragic 79.9% |
| Kiowa | 0.0 /100 | #332 | Tragic 79.8% |
| Inupiat | 0.0 /100 | #333 | Tragic 79.7% |
| Hopi | 0.0 /100 | #334 | Tragic 79.3% |
| Marshallese | 0.0 /100 | #335 | Tragic 79.2% |
| Natives/Alaskans | 0.0 /100 | #336 | Tragic 79.2% |
| Yakama | 0.0 /100 | #337 | Tragic 79.1% |
| Pima | 0.0 /100 | #338 | Tragic 79.0% |
| Apache | 0.0 /100 | #339 | Tragic 79.0% |
| Ute | 0.0 /100 | #340 | Tragic 78.9% |
| Immigrants | Yemen | 0.0 /100 | #341 | Tragic 78.2% |
| Tohono O'odham | 0.0 /100 | #342 | Tragic 77.7% |
| Lumbee | 0.0 /100 | #343 | Tragic 77.3% |