Uruguayan vs Native/Alaskan In Labor Force | Age 30-34
COMPARE
Uruguayan
Native/Alaskan
In Labor Force | Age 30-34
In Labor Force | Age 30-34 Comparison
Uruguayans
Natives/Alaskans
84.9%
IN LABOR FORCE | AGE 30-34
78.5/ 100
METRIC RATING
144th/ 347
METRIC RANK
79.2%
IN LABOR FORCE | AGE 30-34
0.0/ 100
METRIC RATING
336th/ 347
METRIC RANK
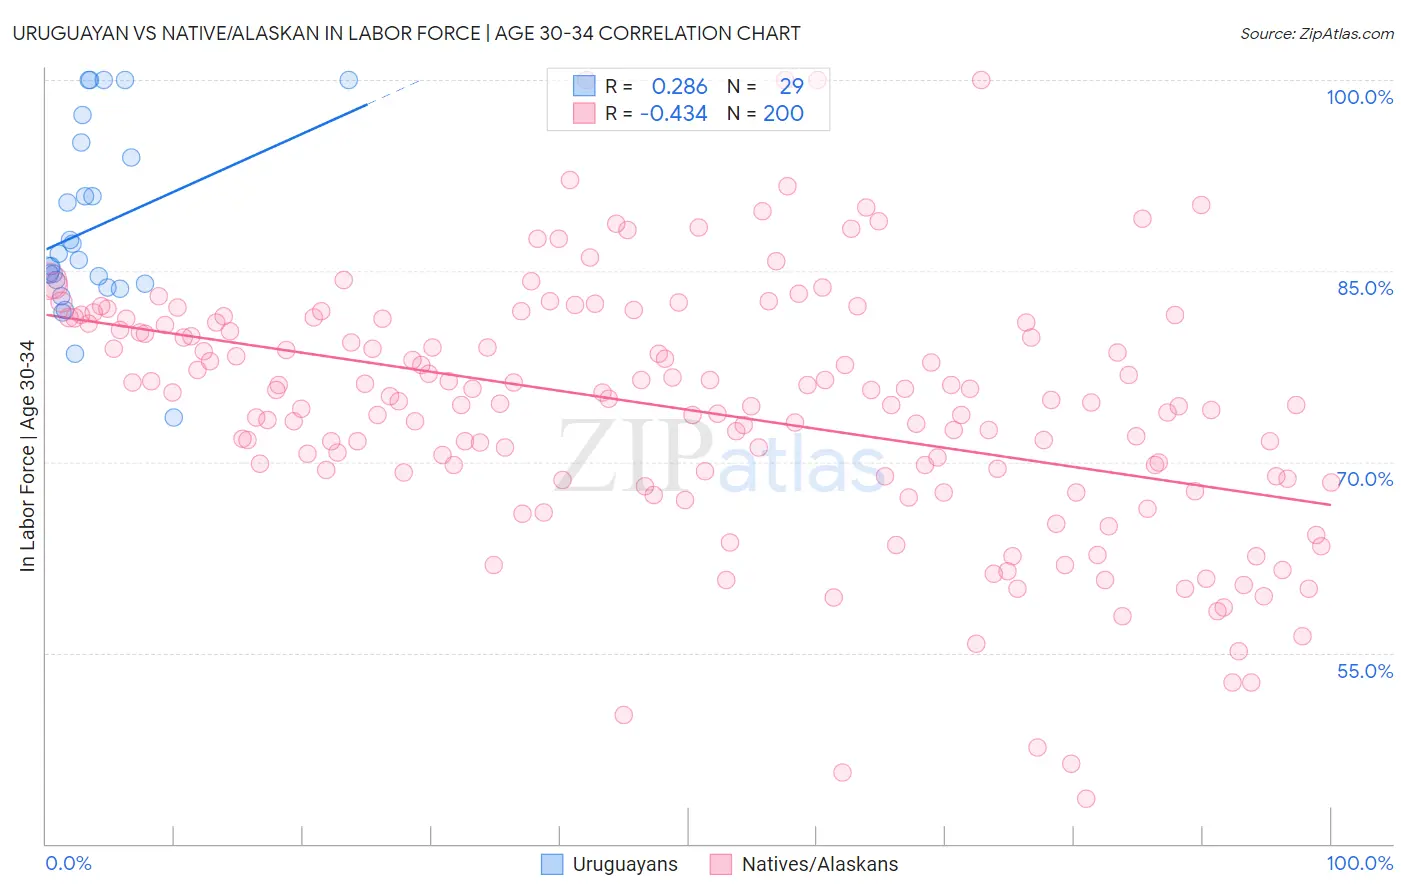
Uruguayan vs Native/Alaskan In Labor Force | Age 30-34 Correlation Chart
The statistical analysis conducted on geographies consisting of 144,764,526 people shows a weak positive correlation between the proportion of Uruguayans and labor force participation rate among population between the ages 30 and 34 in the United States with a correlation coefficient (R) of 0.286 and weighted average of 84.9%. Similarly, the statistical analysis conducted on geographies consisting of 512,461,419 people shows a moderate negative correlation between the proportion of Natives/Alaskans and labor force participation rate among population between the ages 30 and 34 in the United States with a correlation coefficient (R) of -0.434 and weighted average of 79.2%, a difference of 7.2%.
In Labor Force | Age 30-34 Correlation Summary
| Measurement | Uruguayan | Native/Alaskan |
| Minimum | 73.5% | 43.5% |
| Maximum | 100.0% | 100.0% |
| Range | 26.5% | 56.5% |
| Mean | 88.4% | 74.1% |
| Median | 85.8% | 74.8% |
| Interquartile 25% (IQ1) | 83.8% | 68.9% |
| Interquartile 75% (IQ3) | 94.5% | 80.9% |
| Interquartile Range (IQR) | 10.7% | 12.0% |
| Standard Deviation (Sample) | 7.2% | 10.0% |
| Standard Deviation (Population) | 7.0% | 10.0% |
Similar Demographics by In Labor Force | Age 30-34
Demographics Similar to Uruguayans by In Labor Force | Age 30-34
In terms of in labor force | age 30-34, the demographic groups most similar to Uruguayans are Palestinian (84.9%, a difference of 0.010%), Immigrants from Saudi Arabia (84.9%, a difference of 0.020%), Immigrants from Colombia (84.9%, a difference of 0.020%), Immigrants from Pakistan (84.9%, a difference of 0.020%), and Immigrants from Ukraine (84.8%, a difference of 0.030%).
| Demographics | Rating | Rank | In Labor Force | Age 30-34 |
| South Africans | 88.0 /100 | #137 | Excellent 85.0% |
| Sri Lankans | 87.8 /100 | #138 | Excellent 85.0% |
| Bhutanese | 87.5 /100 | #139 | Excellent 85.0% |
| Immigrants | Vietnam | 86.5 /100 | #140 | Excellent 85.0% |
| Chileans | 85.3 /100 | #141 | Excellent 84.9% |
| Immigrants | Indonesia | 84.3 /100 | #142 | Excellent 84.9% |
| Colombians | 82.2 /100 | #143 | Excellent 84.9% |
| Uruguayans | 78.5 /100 | #144 | Good 84.9% |
| Palestinians | 77.7 /100 | #145 | Good 84.9% |
| Immigrants | Saudi Arabia | 76.6 /100 | #146 | Good 84.9% |
| Immigrants | Colombia | 76.3 /100 | #147 | Good 84.9% |
| Immigrants | Pakistan | 76.2 /100 | #148 | Good 84.9% |
| Immigrants | Ukraine | 75.1 /100 | #149 | Good 84.8% |
| Germans | 75.1 /100 | #150 | Good 84.8% |
| Immigrants | Senegal | 74.0 /100 | #151 | Good 84.8% |
Demographics Similar to Natives/Alaskans by In Labor Force | Age 30-34
In terms of in labor force | age 30-34, the demographic groups most similar to Natives/Alaskans are Yakama (79.1%, a difference of 0.040%), Marshallese (79.2%, a difference of 0.080%), Hopi (79.3%, a difference of 0.12%), Pima (79.0%, a difference of 0.16%), and Apache (79.0%, a difference of 0.19%).
| Demographics | Rating | Rank | In Labor Force | Age 30-34 |
| Creek | 0.0 /100 | #329 | Tragic 80.4% |
| Pueblo | 0.0 /100 | #330 | Tragic 80.0% |
| Houma | 0.0 /100 | #331 | Tragic 79.9% |
| Kiowa | 0.0 /100 | #332 | Tragic 79.8% |
| Inupiat | 0.0 /100 | #333 | Tragic 79.7% |
| Hopi | 0.0 /100 | #334 | Tragic 79.3% |
| Marshallese | 0.0 /100 | #335 | Tragic 79.2% |
| Natives/Alaskans | 0.0 /100 | #336 | Tragic 79.2% |
| Yakama | 0.0 /100 | #337 | Tragic 79.1% |
| Pima | 0.0 /100 | #338 | Tragic 79.0% |
| Apache | 0.0 /100 | #339 | Tragic 79.0% |
| Ute | 0.0 /100 | #340 | Tragic 78.9% |
| Immigrants | Yemen | 0.0 /100 | #341 | Tragic 78.2% |
| Tohono O'odham | 0.0 /100 | #342 | Tragic 77.7% |
| Lumbee | 0.0 /100 | #343 | Tragic 77.3% |